Your affiliate program generated €2.8M in player deposits last quarter. Your top 10 affiliates account for 60% of that volume. Finance approved €420K in commission payouts.
🎯 Unlock the full potential of your gambling business
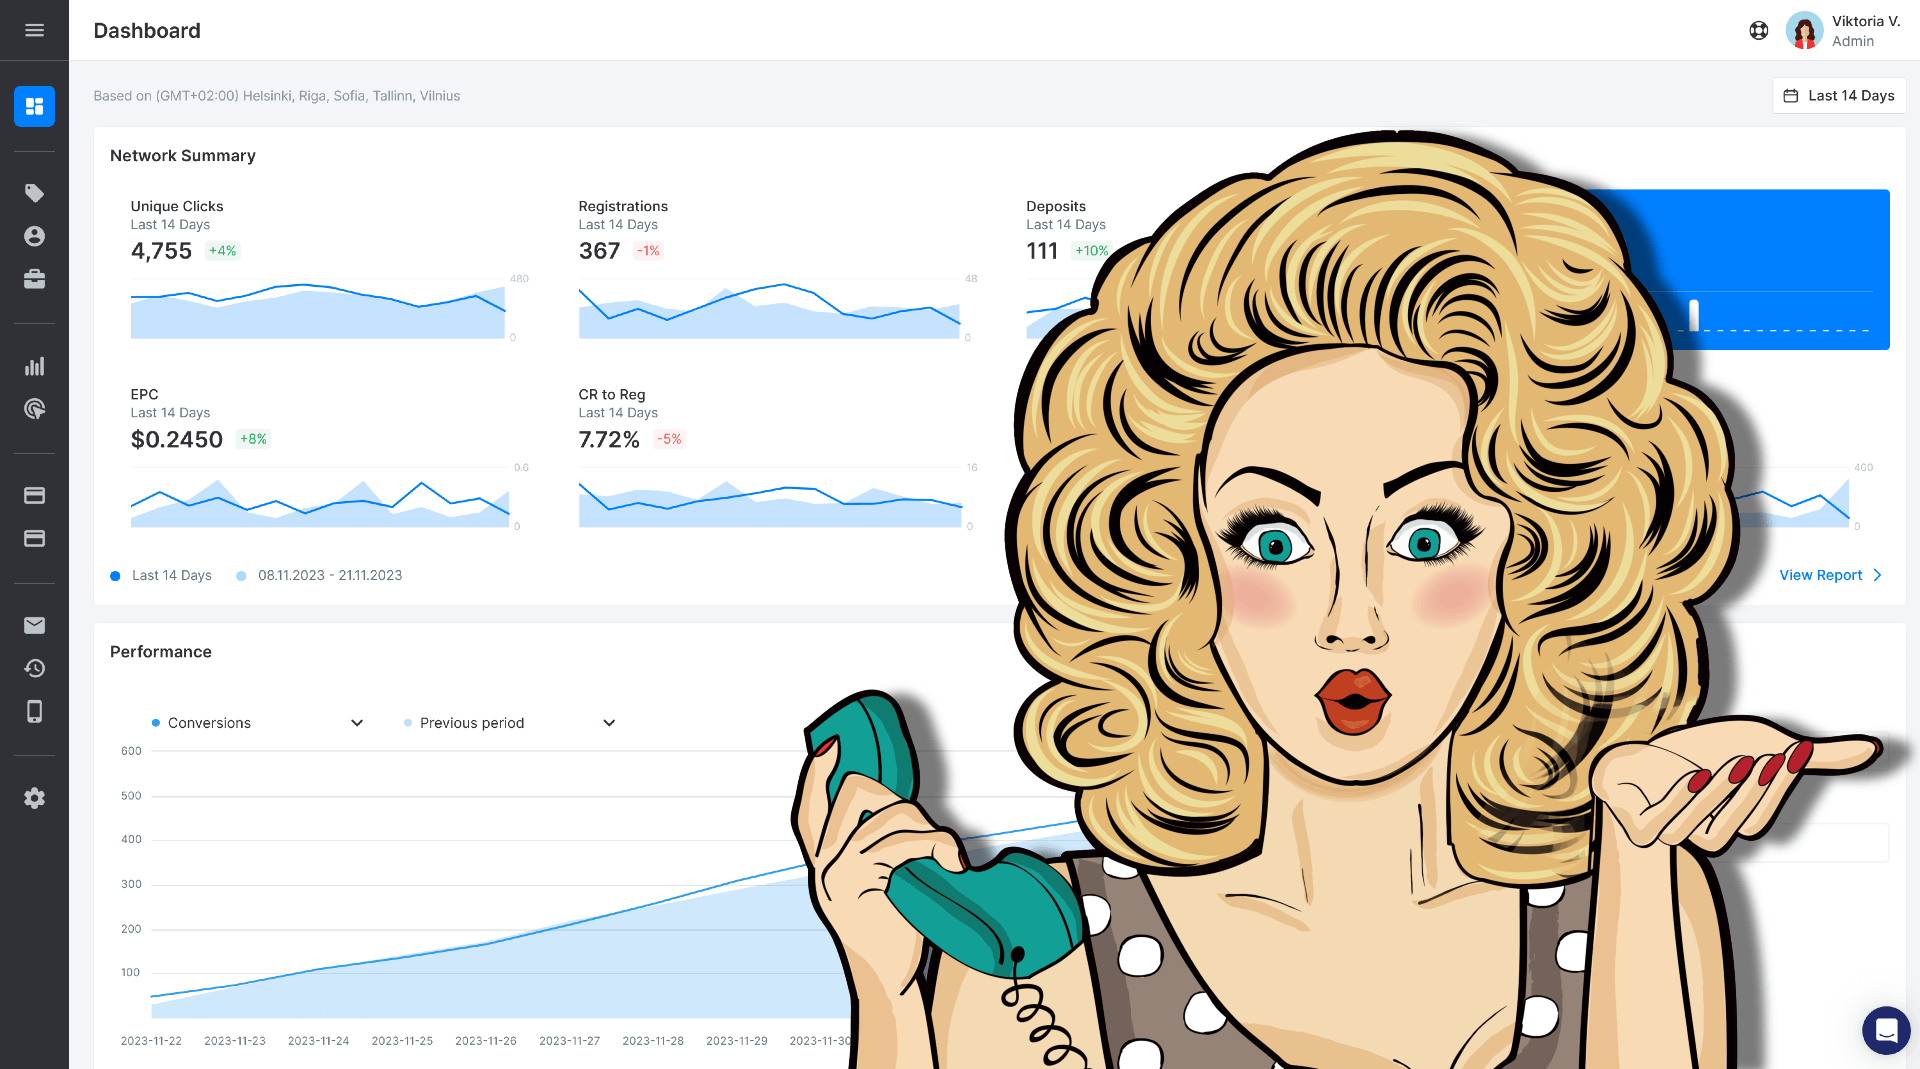
Get actionable insights into your players’ funnel. In-depth reports let you discover your players’ journeys, from clicking on an affiliate link to registration and deposit.
But here’s what you don’t know from those numbers alone:
Which affiliates send players who churn in 30 days versus which send 18-month LTV contributors?
Whether your 35% RevShare rate is profitable after accounting for bonuses, taxes, and payment processing fees. If the affiliate driving 200 FTDs monthly is actually sending bonus hunters who cost you money. Which traffic sources are trending up in quality before your competitors notice and poach those partners.
Most casino operators track vanity metrics—clicks, conversions, gross commission spend—while ignoring the financial intelligence that determines whether their affiliate program is a profit center or a budget drain disguised as growth.
We, the team behind Scaleo, work with casino operators across 40+ jurisdictions managing affiliate programs from €500K to €50M+ in annual commission spend. The operators who scale profitably are the ones who track metrics that connect affiliate performance to actual business outcomes: player profitability, true acquisition cost, lifetime value by source, and fraud exposure.
This guide covers the five metrics that separate operators who optimize affiliate spend from operators who just process payouts and hope for the best.
Why Most Affiliate Metrics Are Theater (Not Intelligence)
The standard affiliate dashboard shows: clicks, conversion rate, CPA, total commission paid. These are activity metrics, not profitability metrics.
Activity metrics tell you what happened. Profitability metrics tell you whether it was worth it.
A casino operator paying attention only to activity metrics makes decisions like:
- “Affiliate A drove 150 FTDs at €90 CPA. Great performance, let’s increase their commission.“
- Reality: Those 150 players had 22% Month-3 retention and €180 average LTV. You paid €13,500 in CPA to acquire players worth €27,000 total. Net: €13,500 profit. Sounds good.
- But Affiliate B drove 80 FTDs at €110 CPA. Lower volume, higher CPA, so you didn’t prioritize them.
- Reality: Those 80 players had 68% Month-3 retention and €520 average LTV. You paid €8,800 to acquire players worth €41,600 total. Net: €32,800 profit—nearly 3x Affiliate A’s contribution despite half the volume.
Without tracking player quality metrics tied to affiliate source, you systematically underinvest in your most profitable partners and overpay for volume that doesn’t create real value.
The five metrics below are the ones that change how you allocate commission budget, negotiate deals, and identify which affiliates deserve tier upgrades versus which ones deserve traffic quality conversations.
Metric 1: Player Lifetime Value by Affiliate Source (LTV by Source)
What it measures: The total net revenue a player generates over their lifetime, segmented by which affiliate referred them.
Why it matters: Not all affiliates are created equal. Some send players who deposit once, claim the welcome bonus, and disappear. Others send players who become regular depositors over 12-18 months. Your commission structure should reward long-term value, not just volume.
How to Calculate LTV by Affiliate Source
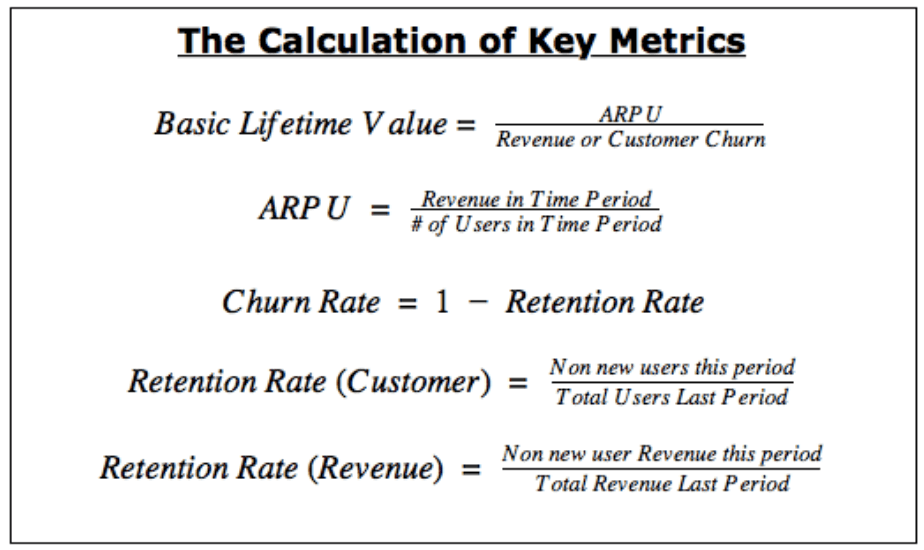
Player Lifetime Value (by affiliate) =
  Total deposits from players referred by Affiliate X
  - Total withdrawals
  - Total bonuses issued
  - Payment processing fees
  - Chargebacks
  = Net revenue per affiliate source

Then divide by player count:
Average LTV per player = Net revenue / Number of players referred
What Good LTV Looks Like?
High-LTV affiliate profile:
- Average player deposits 6+ times over 12 months
- 60%+ retention at Month-3
- €400-€800 average LTV per player
- Low bonus abuse rate (<5% of players)
- Geographic concentration in high-value markets (UK, Germany, Nordics)
Low-LTV affiliate profile:
- Average player deposits 1-2 times
- <30% retention at Month-3
- €80-€150 average LTV per player
- High bonus abuse indicators (uniform deposit amounts, immediate withdrawal attempts)
- Traffic from low-value or restricted markets
How to Use This Metric Operationally
Tier affiliates by LTV contribution, not volume:
Create commission tiers based on average player LTV, not FTD count:
- Tier 1 (Premium): €400+ LTV per player → 40% RevShare or €150 CPA
- Tier 2 (Standard): €200-€399 LTV → 35% RevShare or €100 CPA
- Tier 3 (Trial): <€200 LTV → 30% RevShare or €80 CPA, with 90-day review
Negotiate custom deals with top LTV sources:
Your top 5 affiliates by LTV (not volume) deserve custom commission structures. If Affiliate X consistently delivers €600 average LTV and 70% Month-3 retention, they’re worth 45% RevShare or hybrid deals (€120 CPA + 30% RevShare) that competitors can’t match.
Pause or terminate low-LTV relationships:
Affiliates consistently delivering <€150 LTV are costing you money after acquisition costs. Have the conversation: “Your traffic quality has declined. We’re seeing 18% Month-3 retention versus 45% program average. What’s changed in your traffic sources?”
If traffic quality doesn’t improve within 60 days, exit the relationship. You’re subsidizing unprofitable volume.
How Scaleo Surfaces LTV by Affiliate?
Scaleo’s player lifecycle tracking connects every conversion event (registration, KYC, FTD, recurring deposits, monthly NGR) back to the originating affiliate Click ID. The platform calculates cumulative player value over 12-24 months and segments by affiliate source.
Your dashboard shows:
Affiliate A’s 150 players generated €27,000 total LTV (€180 per player), while Affiliate B’s 80 players generated €41,600 (€520 per player). You immediately see which partnerships create real value versus which ones create activity theater.
Metric 2: True Cost Per Acquisition (True CPA)
What it measures: Your actual cost to acquire one player after accounting for all affiliate commissions, platform fees, fraud losses, and operational overhead—not just the advertised CPA rate.
Why it matters: Most operators calculate CPA as “commission paid divided by FTD count.” This ignores: bonuses not deducted from affiliate commission, fraud losses paid before detection, platform fees, reconciliation labor, chargeback costs. Your real CPA is 20-40% higher than your reported CPA.
How to Calculate True CPA
True Cost Per Acquisition =
  (Total affiliate commissions paid
  + Platform/software fees
  + Fraud losses (paid commissions on fraudulent players)
  + Bonus costs (if not deducted from affiliate commission)
  + Payment processing fees for commissions
  + Reconciliation labor hours × hourly cost)
  / Total legitimate FTDs (excluding fraud)
Example: Advertised vs True CPA
Advertised CPA calculation:
You paid €50,000 in affiliate commissions for 500 FTDs = €100 CPA. Finance approves budget based on this number.
True CPA calculation:
- Affiliate commissions: €50,000
- Platform fees: €2,000
- Fraud losses (40 fraudulent FTDs × €100): €4,000
- Bonus costs (not deducted from commission): €8,000
- Payment processing (wire fees, PayPal fees): €1,500
- Reconciliation labor (40 hours/month × €50/hour): €2,000
Total cost: €67,500 for 460 legitimate FTDs (500 minus 40 fraud) = €146.74 True CPA
Your real acquisition cost is 47% higher than reported. If you’re approving commission increases based on €100 CPA targets, you’re making decisions on fiction.
What Good CPA Looks Like?
Efficient affiliate program (True CPA optimization):
- True CPA is <15% higher than advertised CPA
- Fraud losses <2% of total commission spend
- Platform fees <5% of commission spend
- Minimal reconciliation overhead (<10 hours/month)
Inefficient affiliate program (hidden cost leakage):
- True CPA is 30-50% higher than advertised
- Fraud losses 8-15% of commission spend
- Manual reconciliation consumes 40+ hours/month
- Bonus costs not accounted for in commission structure
How to Use This Metric Operationally
Set commission rates based on True CPA, not advertised CPA:
If your target acquisition cost is €120 and your True CPA consistently runs 40% higher than advertised, your CPA offers should target €85 advertised (€120 / 1.4) to hit your real profitability threshold.
Audit fraud leakage quarterly:
Track what percentage of paid commissions were later identified as fraudulent. Industry average with basic fraud detection: 8-12%. With behavioral AI fraud detection: 1-3%. The difference on €500K annual commission spend is €40K-€55K saved annually.
Reduce reconciliation overhead:
40 hours/month of finance labor reconciling affiliate data costs €24,000 annually. Platforms with automated reconciliation reduce this to <10 hours/month, saving €18,000/year—enough to justify higher platform fees.
How Scaleo Exposes True CPA
Scaleo’s commission reporting includes platform fees, shows fraud rejection rates by affiliate, and tracks operational overhead in reconciliation workflows. You see exactly how much each affiliate relationship costs including all hidden expenses—not just the headline commission number.
Metric 3: Cohort Retention by Affiliate Source
What it measures: What percentage of players referred by each affiliate are still active (depositing, wagering) at 30, 60, 90, and 180 days after first deposit.
Why it matters: High-volume affiliates who send players that churn in 30 days deliver short-term revenue but terrible long-term economics. You’re paying acquisition costs for players who never generate meaningful LTV. Cohort retention reveals which affiliates send “stick” traffic versus “churn” traffic.
How to Calculate Cohort Retention
Month-3 Retention Rate (by affiliate) =
  (Number of players who deposited in Month 3+
  / Total players acquired in Month 0)
  × 100

Calculate separately for each affiliate to compare quality.
What Good Cohort Retention Looks Like?
Casino industry retention benchmarks (general market):
- Month-1: 40-50% of FTDs remain active
- Month-3: 25-35% remain active
- Month-6: 15-25% remain active
- Month-12: 10-15% remain active
Premium affiliate retention profile:
- Month-1: 55-65% active
- Month-3: 40-50% active
- Month-6: 30-40% active
- Month-12: 20-25% active
Warning sign retention profile:
- Month-1: <30% active
- Month-3: <15% active
- Month-6: <8% active
Affiliates consistently delivering below-benchmark retention are sending bonus hunters, incentivized traffic, or low-intent players. Your acquisition spend on these sources destroys profitability.
How to Use This Metric Operationally
Flag affiliates with declining retention curves:
Set automated alerts when any affiliate’s Month-3 retention drops 20%+ below their historical average or 30%+ below program average. This indicates traffic source changes that require investigation.
Adjust commission based on retention probability:
Implement tiered commission where affiliates demonstrating 45%+ Month-3 retention earn higher rates:
- High retention (>45% Month-3): 40% RevShare
- Standard retention (30-45% Month-3): 35% RevShare
- Low retention (<30% Month-3): 30% RevShare + 90-day review
Optimize bonus structures by affiliate retention:
Affiliates sending high-retention players can justify aggressive welcome bonuses (200% match) because those players generate enough lifetime value to recover bonus costs. Affiliates sending low-retention players should receive reduced bonus budgets (50-100% match) to prevent bonus abuse destroying unit economics.
How Scaleo Tracks Cohort Retention?
Scaleo’s player lifecycle tracking calculates retention curves by affiliate source automatically. Your dashboard shows: Affiliate A’s January cohort has 48% Month-3 retention, while Affiliate B’s January cohort has 22% Month-3 retention. You immediately see which partnerships create durable player value versus which create short-term volume that churns.
Metric 4: Revenue per Mille (RPM) by Traffic Source
What it measures: How much net revenue you generate per 1,000 clicks from each affiliate source, after accounting for all costs.
Why it matters: Some affiliates send massive click volume with terrible conversion rates. Others send modest click volume with exceptional conversion rates. RPM tells you which traffic sources are actually efficient at generating revenue per unit of traffic, not just which ones generate the most clicks.
How to Calculate RPM
Revenue per Mille (RPM) =
  (Net revenue from affiliate source
  / Total clicks from that source)
  × 1,000
Net revenue should account for: player deposits minus withdrawals minus bonuses minus payment fees minus affiliate commission paid.
What Good RPM Looks Like?
Casino RPM benchmarks vary wildly by traffic type:
- SEO content sites (organic): €40-€80 RPM (high intent, lower volume)
- Paid traffic (media buyers): €15-€35 RPM (lower intent, higher volume)
- Email lists (owned audiences): €60-€120 RPM (high trust, targeted)
- Influencers (Twitch/YouTube): €50-€100 RPM (engaged audiences)
- Review sites (comparison): €70-€150 RPM (research intent, high conversion)
Warning signs:
- RPM <€10: Traffic is low quality, poorly targeted, or fraudulent
- RPM declining 30%+ quarter-over-quarter: Traffic source degrading
- RPM variance between affiliates in same category >200%: Investigate why
How to Use This Metric Operationally
Compare affiliates within traffic type, not across types:
Don’t compare media buyer RPM (expected €15-€35) to SEO content site RPM (expected €40-€80). They serve different roles in your acquisition funnel. Compare media buyers to other media buyers to identify which ones are efficient versus which are burning budget on low-quality traffic.
Set RPM floor thresholds by traffic type:
Establish minimum acceptable RPM by category:
- Media buyers: €12 RPM minimum
- SEO sites: €30 RPM minimum
- Influencers: €40 RPM minimum
Affiliates consistently below threshold get 60-day improvement notice. If RPM doesn’t recover, pause the partnership.
Scale high-RPM sources aggressively:
Affiliate delivering €120 RPM with 50K monthly clicks is generating €6,000 net revenue per month. If they can scale to 150K clicks while maintaining €100+ RPM, that’s €15,000 monthly net revenue. Offer higher commission rates, better bonus terms, or exclusive offers to incentivize volume increase.
How Scaleo Calculates RPM
Scaleo’s reporting connects click volume to revenue outcomes by affiliate source. You see: Affiliate X sent 80K clicks generating €4,800 net revenue (€60 RPM), while Affiliate Y sent 120K clicks generating €2,400 net revenue (€20 RPM). Even though Affiliate Y delivers more volume, Affiliate X is 3x more efficient at converting clicks to revenue.
Metric 5: Attribution Accuracy Rate
What it measures: What percentage of actual conversions are correctly attributed to the affiliate who referred them, versus lost to tracking breakage, cross-device gaps, or attribution window expiration.
Why it matters: If your tracking is 70% accurate, you’re systematically underattributing (and underpaying) 30% of conversions. This destroys relationships with your best affiliates, who leave for competitors with better tracking. You also make budget decisions on incomplete data, scaling channels that appear weak but are actually strong—if only you could measure them correctly.
How to Calculate Attribution Accuracy
This is harder to measure directly because you need ground truth (what actually happened) versus what your system captured. Proxies:
Server-side vs client-side tracking comparison:
Run parallel tracking for 30 days (both S2S postback and client-side pixel). Compare conversion counts. The delta reveals how many conversions client-side tracking loses (typically 30-45% of Safari/iOS traffic).
Affiliate-reported conversions vs platform-recorded conversions:
Compare what affiliates report (from their side) versus what your platform records. Persistent >10% discrepancies indicate tracking breakage.
Cross-device conversion recovery rate:
Of players who click on mobile but convert on desktop, what percentage successfully attributes? Industry average with cookie-based tracking: 15-30% recovery. With server-side tracking and logged-in user matching: 70-85% recovery.
What Good Attribution Accuracy Looks Like?
High attribution accuracy program:
- <5% discrepancy between affiliate-reported and platform-recorded conversions
- 85%+ of cross-device conversions successfully attribute
- Mobile (Safari/iOS) attribution within 10% of Android attribution rates (similar market share = similar conversion rates expected)
Low attribution accuracy program:
- 15% discrepancy between affiliate and platform numbers (triggers disputes)
- <40% cross-device attribution recovery
- Mobile (Safari/iOS) attribution 40%+ lower than expected based on traffic share (tracking breakage)
How to Use This Metric Operationally?
Migrate to server-side tracking immediately:
If you’re still using pixel/cookie-based tracking in 2026, you’re losing 30-45% of mobile conversions. Server-side postback tracking from your gaming platform eliminates browser-based tracking restrictions. This isn’t a “nice to have”—it’s table stakes.
Extend attribution windows to match sales cycle:
Casino players research for days or weeks before depositing. If your attribution window is 7 days but average time-to-conversion is 14 days, you’re systematically losing conversions that happen outside the window. Extend to 30-90 days.
Communicate attribution methodology to affiliates:
Disputes happen when affiliates think they should get credit but your system doesn’t attribute them. Transparent communication about attribution rules (first-click? last-click? 30-day window?) reduces disputes. Better yet: let affiliates see the attribution chain in their dashboard.
How Scaleo Maximizes Attribution Accuracy?
Scaleo’s server-side postback tracking bypasses browser restrictions entirely. Your gaming platform fires conversion events (registration, deposit, NGR) directly to Scaleo’s API. Click IDs persist for 365+ days, covering even the longest research cycles. Cross-device attribution is handled through logged-in player matching once accounts are created.
Result: 90%+ attribution accuracy versus 60-70% with cookie-based platforms. This means 30% more conversions correctly credited to affiliates, preventing relationship damage and giving you accurate data for budget decisions.
The Metrics You’re Not Tracking Are Costing You Money
Most casino operators optimize affiliate spend using rear-view metrics: last month’s conversions, last quarter’s commission spend, year-over-year growth. These tell you what happened, not whether it was profitable or sustainable.
The five metrics above—LTV by source, True CPA, cohort retention, RPM, and attribution accuracy—are forward-looking intelligence. They tell you:
- Which affiliates to scale (high LTV, high retention, high RPM)
- Which affiliates need traffic quality conversations (declining retention, low RPM)
- Which affiliates to exit (low LTV, True CPA exceeds target, attribution disputes)
- Where your tracking is broken (attribution accuracy gaps)
- What your real acquisition costs are (True CPA including all hidden costs)
Operators tracking these metrics make decisions like:
“Affiliate A drives 200 FTDs/month at €90 CPA, but their Month-3 retention is 18% versus 42% program average, and their True CPA is €140 after fraud losses. We’re cutting them from Tier 2 to Tier 3 commission and requiring traffic source documentation.”
Some operators not tracking these metrics we have seen make decisions like:
“Affiliate A drives 200 FTDs/month. Great volume. Let’s increase their commission to 40% RevShare to keep them happy.”
The first operator is optimizing for profitability. The second operator is optimizing for activity theater while watching margins erode.
How to Implement These Metrics (Starting Monday)
Week 1: Audit your current tracking capability
Can your platform calculate LTV by affiliate source? Does it track cohort retention? Can you see True CPA including platform fees and fraud losses? If not, you’re flying blind. Identify the gaps.
Week 2: Implement server-side tracking
If you’re still on pixel/cookie tracking, migrate to S2S postback integration with your gaming platform. This is the single highest-ROI technical change you can make. Fixes 30-45% attribution loss on mobile traffic.
Week 3: Baseline your top 20 affiliates
Calculate LTV, True CPA, Month-3 retention, and RPM for your top 20 partners (by volume). Rank them by each metric. You’ll discover your highest-volume partners aren’t always your most profitable partners.
Week 4: Adjust commission tiers based on quality
Move affiliates with 45%+ Month-3 retention and €400+ LTV to premium tiers. Move affiliates with <25% retention and <€180 LTV to probation tiers with 60-day improvement requirements.
The operators who do this work see:
- 15-25% reduction in True CPA (cutting low-quality sources)
- 30-50% increase in Month-12 player retention (scaling high-quality sources)
- 40-60% reduction in affiliate disputes (better tracking accuracy)
- 20-35% improvement in affiliate program profitability (optimizing for LTV, not volume)
The operators who don’t do this work continue optimizing for vanity metrics while wondering why their affiliate program generates revenue but not profit.
Need to track these metrics for your casino affiliate program? Scaleo provides player lifecycle tracking showing LTV by affiliate source, cohort retention analysis, True CPA calculation including platform fees and fraud losses, RPM reporting by traffic type, and server-side attribution delivering 90%+ accuracy. Built for casino operators who optimize affiliate spend based on profitability, not activity. Contact our team to see how proper metric tracking changes commission strategy and program profitability.