
Analyzing “GGR” and “NGR” can feel like finance jargon — but if you’re operating an online casino, these metrics are not optional. They’re the quickest way to see whether you’re actually printing money… or just generating volume while costs quietly eat you alive.
- Gross Gaming Revenue (GGR) tells you how much players lost (before operational deductions).
- Net Gaming Revenue (NGR) tells you what’s left after the real-world costs: bonuses, fees, taxes, provider costs, and other deductions that directly affect profitability.
If you want to outcompete other casinos, don’t obsess over “more traffic” first. Obsess over what happens after traffic lands: conversion, deposits, bonus cost, retention, and whether your acquisition channels are profitable once you calculate NGR properly.
TL;DR — GGR vs NGR in One Minute
- GGR = Total Bets − Total Wins (what players lost).
- NGR = GGR − (Bonuses + Payment Fees + Taxes/Licensing + Provider Fees + Chargebacks + Other agreed deductions).
- Affiliate commissions are usually paid on NGR (or a variant of it), which is why NGR definition must be explicit.
- Negative carryover decides whether an affiliate’s “negative month” rolls into the next month or resets — huge impact on long-term payout fairness and disputes.

One of the most critical parts of an online casino’s success is marketing: player acquisition + retention. But “marketing” without KPIs is just vibes. To measure what’s working (and what’s bleeding cash), operators rely on revenue and player-performance KPIs — and GGR/NGR sit right at the center.
How To Analyze & Improve GGR and NGR – Operator’s CheatSheet
| Step | What You Need To Do? |
|---|---|
| 1. Understand Metrics 🧮 | Lock the definitions. GGR is wagers minus wins. NGR is GGR minus deductions like bonuses, taxes, fees, provider costs, and other agreed costs. |
| 2. Data Collection 📊 | Pull consistent inputs: bets, wins, bonus cost, payment fees, taxes, provider/royalty fees, chargebacks, and marketing costs. |
| 3. Define Your NGR Rules 🔍 | Write down what counts as “deductible” in your business (and in affiliate agreements). If you don’t define it, you’ll negotiate it later. |
| 4. Analyze Player Behavior 👤 | Study deposit behavior, retention, VIP share, bonus usage, and how cohorts evolve after acquisition. |
| 5. Review Game Performance 🎮 | Identify which games drive volume vs which drive profit (margin differs heavily by provider, RTP, and player type). |
| 6. Optimize Game Selection 🕹️ | Adjust your lobby and promo focus toward high-margin, high-retention segments — not just “popular games.” |
| 7. Adjust Bonuses and Promotions 🎁 | Bonuses can inflate GGR while destroying NGR. Track bonus cost by cohort/source and cap where needed. |
| 8. Monitor Competitor Strategies 🏆 | Benchmark bonus aggressiveness, retention mechanics, and VIP strategy — but copy only what survives NGR math. |
| 9. UX Improvements 🌐 | Improve onboarding, KYC funnel, deposit flow, and mobile UX — conversion affects GGR; retention affects NGR. |
| 10. Affiliate Program Analysis 🤝 | Track acquisition channels (including affiliates) with clarity: cost per depositor, retention quality, bonus abuse, and net profitability per source. |
| 11. Cost Management 💰 | Optimize payment fees, provider deals, fraud losses, and operational leakage — NGR improves when waste drops. |
| 12. Legal and Compliance Check 📜 | Compliance issues destroy margin fast (fines, withheld payments, blocked markets). Treat it as a KPI risk factor. |
| 13. Market Trends Analysis 📈 | React to macro events (sports calendars, regulation changes, payments constraints) with forecasts and budget planning. |
| 14. Continuous Monitoring 🔁 | Watch KPIs weekly, not monthly. Spikes in bonuses, fees, or churn show up early if you’re looking. |
| 15. Implement Changes & Test 🔧 | A/B test promos, landing pages, and retention flows — but always evaluate impact on NGR, not just deposits. |
How to Analyze and Improve GGR?
Gross Gaming Revenue (GGR) is the amount the operator retains from gameplay before deductions — basically, how much players lost. It’s a top-line revenue KPI, and it’s useful… but it can also be misleading when bonuses and operational costs balloon.
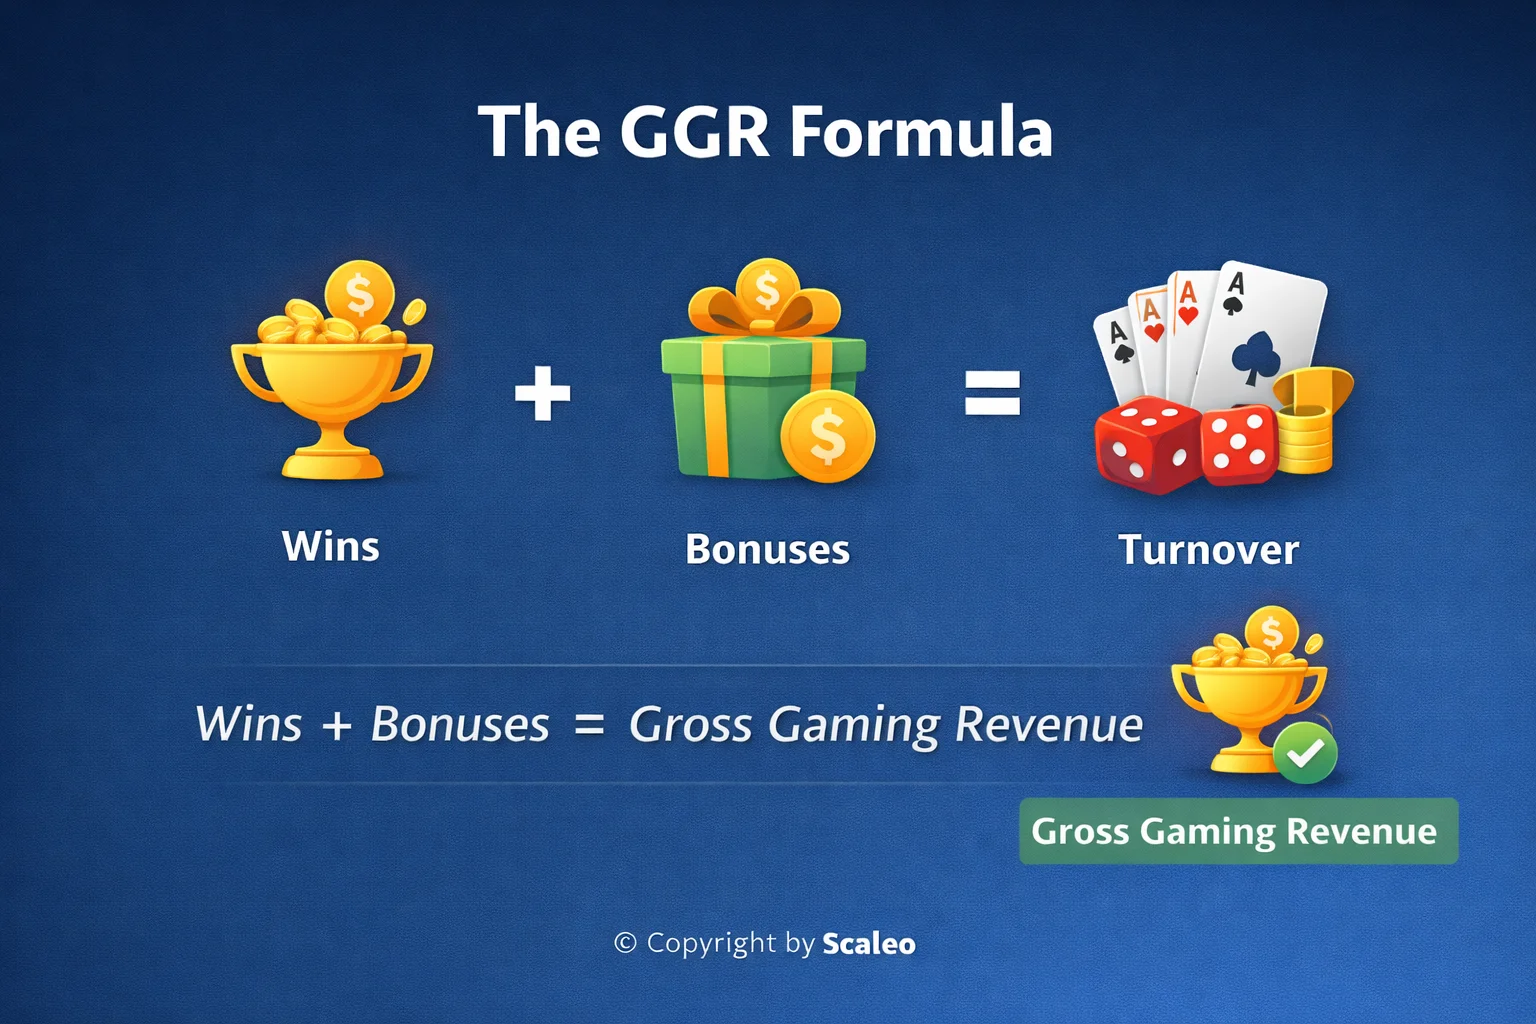
Below is a cheat sheet that breaks down the steps for analyzing and optimizing GGR — with a focus on turning “volume” into something that survives the NGR calculation.
| Step | Action | Description | Tools/Methods |
|---|---|---|---|
| 1. Data Collection | Gather all relevant data | Collect data on bets, payouts, player behavior, game performance, and bonuses. | Analytics tools, CRM systems, SQL, data warehouse |
| 2. Segment Analysis | Analyze player segments | Split by VIP/casual/high rollers, geo, device, acquisition source, bonus usage. | Cohort analysis, segmentation tools |
| 3. Game Performance | Evaluate game profitability | Identify games that drive GGR but destroy margin vs games that retain profitable cohorts. | Game-level reports, profitability analysis |
| 4. Payout Ratio | Optimize payout ratios | Benchmark RTP and game mix to remain competitive without sacrificing margin. | Statistical analysis, benchmarking |
| 5. Bonus Analysis | Evaluate promotions | Track bonus cost by cohort/source and cap abuse patterns early. | A/B testing, bonus tracking tools |
| 6. Player Retention | Improve retention | Retention lifts NGR more reliably than short-term acquisition spikes. | CRM systems, retention analysis |
| 7. Churn Analysis | Reduce churn | Model churn patterns and identify segments that drop off after first deposit. | Predictive analytics, churn modeling |
| 8. Marketing ROI | Measure ROI | Evaluate acquisition channels based on NGR outcomes, not just deposit volume. | Attribution, ROI calculators |
| 9. UX/UI Optimization | Increase conversion | Improve deposit flow, KYC, speed, mobile UX, and onboarding. | User testing, heatmaps, UX tools |
| 10. Regulatory Compliance | Manage compliance risk | Avoid fines/market issues that can destroy net profitability. | Compliance workflows, audits |
| 11. Fraud Detection | Stop leakage | Fraud inflates acquisition metrics while harming NGR. | Fraud systems, risk scoring |
| 12. Monitor Competitors | Benchmark | Track competitor promo patterns and adjust strategically. | Competitive analysis, industry reports |
| 13. Financial Forecasting | Forecast performance | Build models to predict GGR/NGR across seasonality and campaigns. | Excel, BI tools |
| 14. Continuous Improvement | Iterate weekly | Run a feedback loop: measure → adjust → test → repeat. | KPI dashboards, experiments |
GGR vs NGR
GGR and NGR sound similar, but they answer different questions. GGR tells you what the games generated. NGR tells you what the business actually retained after deductions.
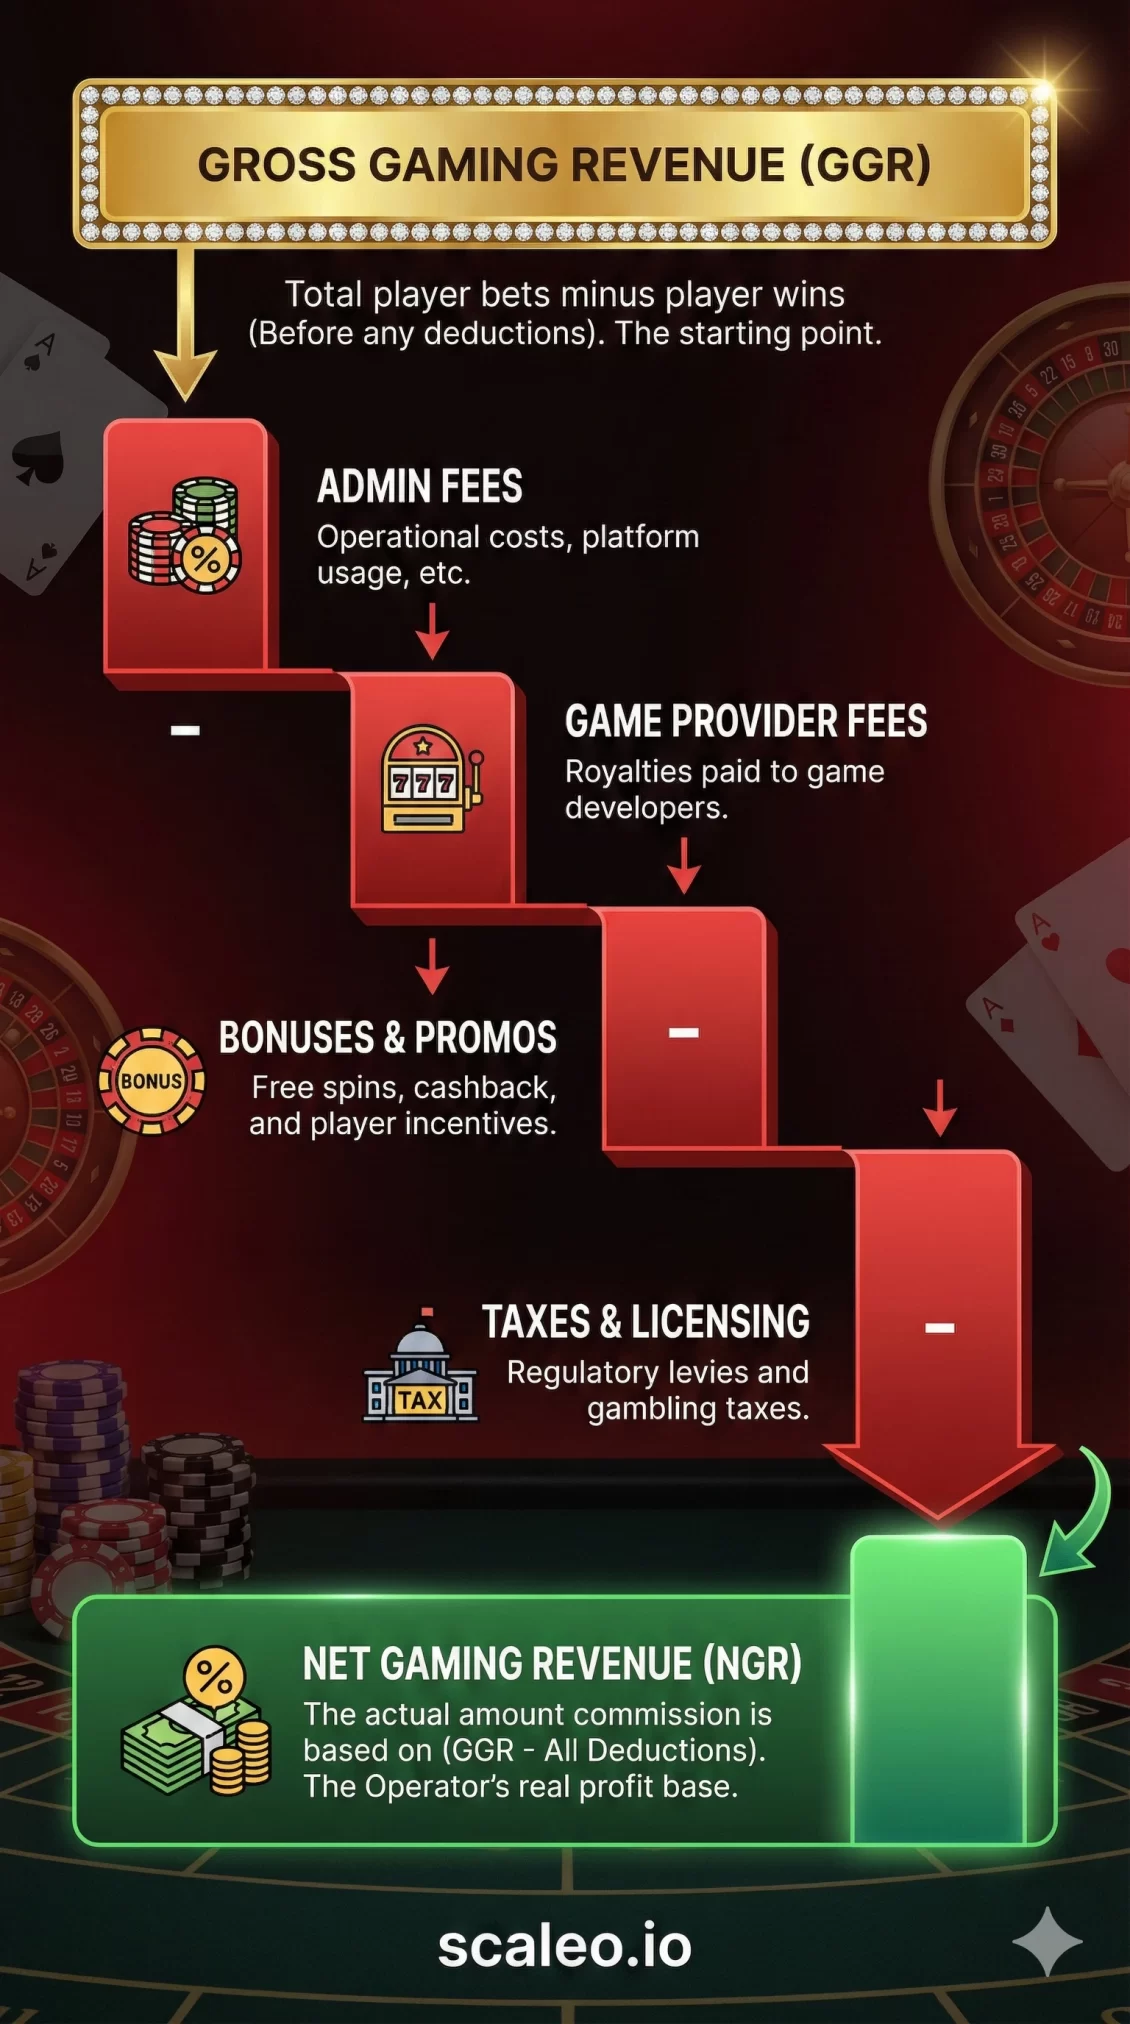
Here’s the clean comparison:
| Aspect | Gross Gaming Revenue (GGR) | Net Gaming Revenue (NGR) |
|---|---|---|
| Definition | Total revenue generated from player wagers before deductions. | Revenue remaining after deducting bonuses, taxes, fees, provider costs, and other agreed deductions from GGR. |
| Formula | GGR = Total Bets – Total Wins | NGR = GGR – (Bonuses + Taxes + Fees + Provider Costs + Other Costs) |
| Purpose | Shows scale of wagering activity and top-line revenue. | Shows profitability and operational efficiency. |
| Bonus impact | Bonuses don’t change GGR directly. | Bonuses reduce NGR (often significantly). |
| Why it matters | Useful, but can look “great” even when profit is weak. | Harder to fake. Closer to business reality. |
| Affiliate relevance | Some deals use GGR-based RevShare. | Most operator-friendly RevShare models are NGR-based (with a clear deduction definition). |
The table above explains the difference, but in real operator life the important part is the NGR definition — what gets deducted, in what order, and what your finance team (and affiliates) will accept as “fair.”
This is why NGR causes arguments: two brands can have the same GGR, but completely different NGR depending on bonus policy, payment fees, taxes/licensing, provider costs, and chargebacks. The waterfall below shows the logic at a glance.
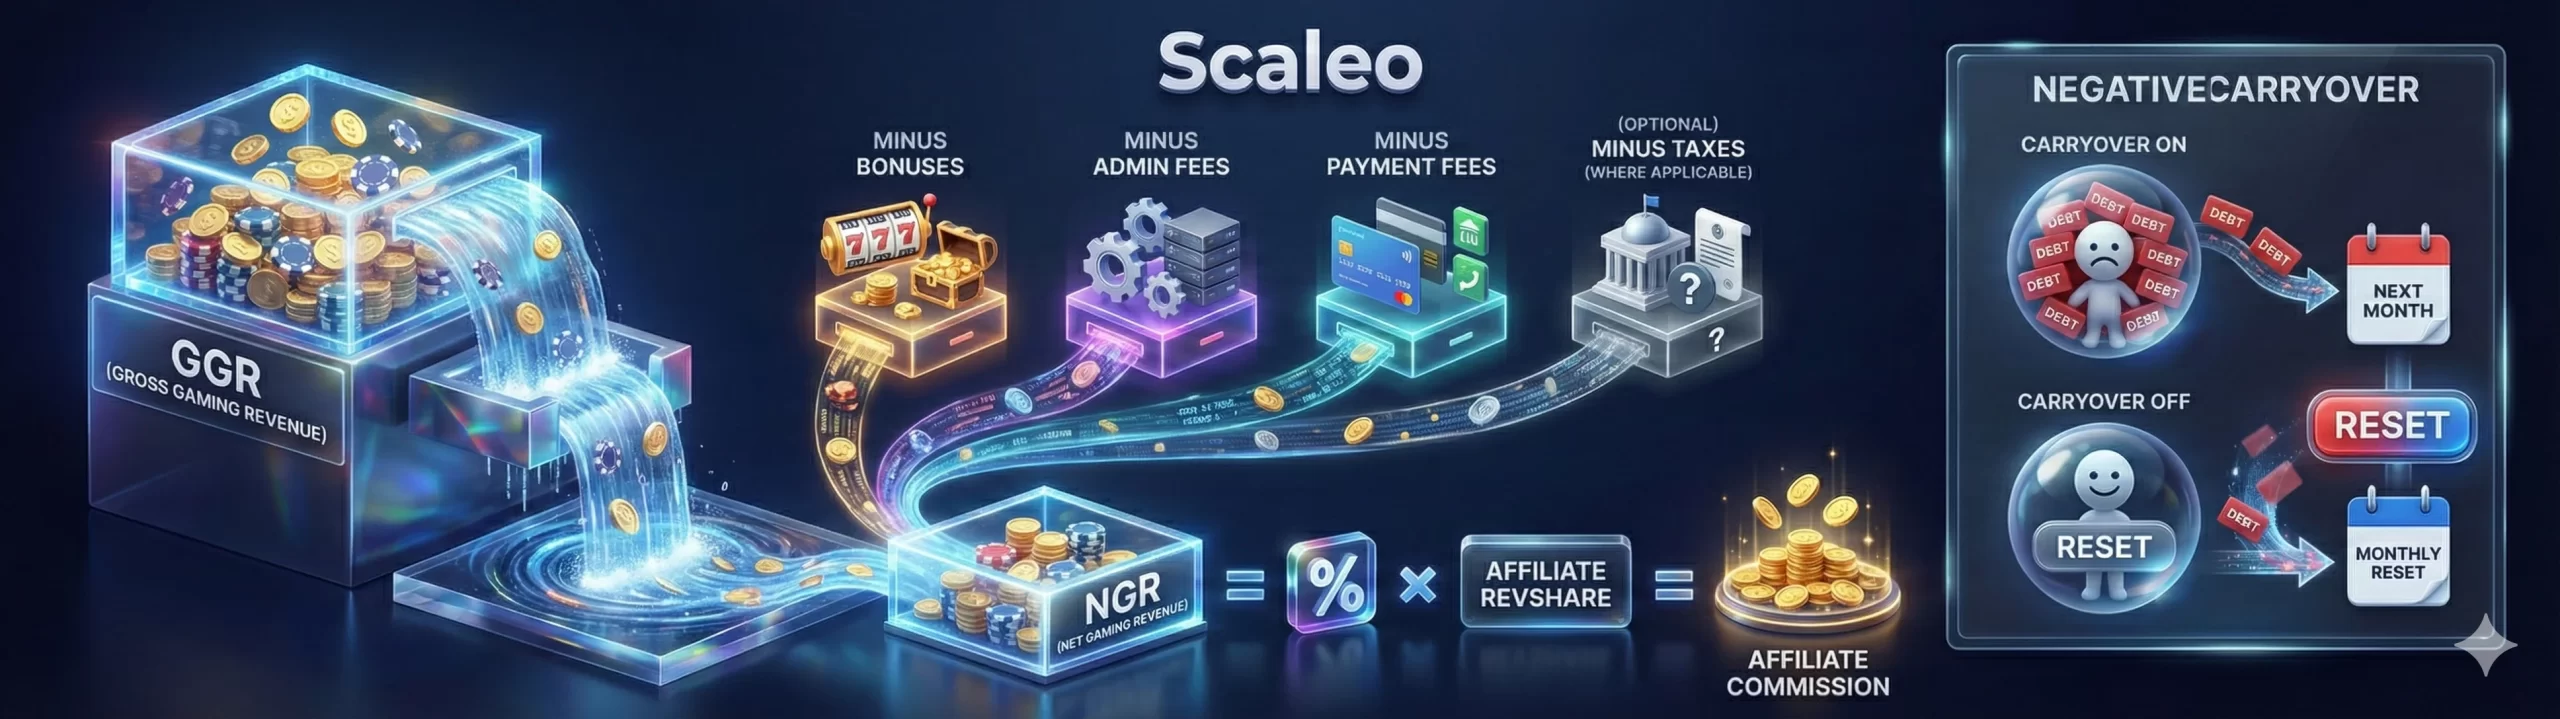
Operator note: NGR isn’t one universal formula — it’s a contract definition.
The moment you pay affiliates on RevShare “based on NGR,” you need to document what’s deductible (bonuses, payment fees, taxes, provider fees, chargebacks, fraud adjustments) to avoid month-end disputes and retroactive “rule changes.”
If you want this to be airtight, add one sentence to your affiliate T&Cs: “NGR is calculated as GGR minus the following deductions…” and list them. That one line saves you more money than most “optimization” projects.
The NGR Waterfall: What Actually Gets Deducted (and why affiliates argue about it)
NGR isn’t one universal formula — it’s a definition. The important part is agreeing on what counts as a deduction. Most operators deduct some combination of bonuses, payment processing fees, taxes/licensing, provider/royalty costs, chargebacks, and fraud-related losses.
This is also why NGR shows up inside affiliate agreements: if RevShare is paid on “NGR,” both sides need clarity. Otherwise, you get the classic dispute: “your NGR is too low” vs “your traffic is too expensive.”
Money Related KPIs
Money-related KPIs are the ones that directly map to profitability. The most basic revenue KPI is GGR, calculated by subtracting total wins from total bets.
GGR indicates how much money stays with the casino before deducting expenses.
NGR shows the casino’s earnings after deducting costs such as bonuses, payment processing fees, provider/royalty fees, chargebacks, and taxes.
The NGR-to-deposits metric shows how much net revenue is generated from player deposits. Bets-to-deposits indicates how much deposited money circulates through gameplay.
People-related KPIs focus on players and their behavior.
Conversion rate measures the share of users who complete a desired action (registration, deposit, KYC) out of total visitors. Low conversion often signals traffic quality issues, funnel friction, or a weak offer.

Player lifetime value (LTV) shows how much revenue a player generates over time. Operators increase LTV to maximize profitability. Churn and bounce rate help you spot retention and engagement problems.
Hybrid KPIs
Hybrid KPIs connect financial metrics with player behavior. Cost per acquisition (CPA) is the cost to acquire one player. ARPU estimates average revenue per player over a time period.
Online casino operators rely on affiliate platforms and CRM/analytics systems to monitor acquisition sources, partner performance, and the net profitability of marketing channels.
By tracking KPIs consistently, operators can make smarter decisions and improve both GGR and NGR.
The Importance of GGR and NGR KPIs in Marketing Strategy
Marketing strategy drives acquisition and retention, but KPIs decide whether that strategy is profitable. Player acquisition KPIs (conversion rate, depositor rate, CAC/CPA) help you evaluate campaigns. Retention KPIs (churn, LTV, ARPU) tell you whether acquired players actually become profitable cohorts.
Understanding and monitoring GGR and NGR is also useful for affiliates and affiliate managers because it clarifies how commissions are calculated and what “net” actually means in practice.
Calculating GGR and NGR KPIs
Key performance indicators (KPIs) give you measurable inputs for decision-making. Below are the two core formulas — plus the definitions that prevent “NGR disagreements” later.
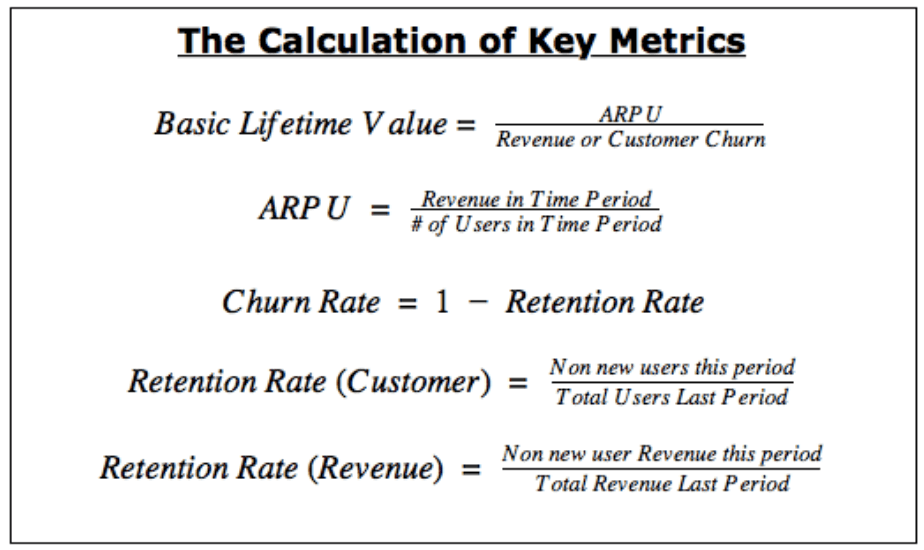
How to Calculate Gross Gaming Revenue (GGR)
GGR is the total amount the operator retains from gameplay before deductions. The calculation is simple:
GGR = Total Amount Wagered – Total Amount Paid Out
Total amount wagered is the sum of all bets. Total amount paid out is the sum of player winnings. The difference is GGR.
Example: If total wagers are $37M and total payouts are $23M, then GGR = $14M.
How to Calculate Net Gaming Revenue (NGR)
NGR is GGR minus deductions. The exact list of deductions depends on your operation and (often) your affiliate agreement definitions. Typical deductions include:
- Bonuses & promotions: free spins, match bonuses, cashback, VIP comps (depending on definition).
- Taxes & licensing fees: gaming tax, licensing costs, market-specific fees.
- Payment processing fees & chargebacks: deposits/withdrawals fees, payment provider costs, chargeback losses.
- Provider/royalty fees: game provider revenue share, aggregator fees, platform royalties (where applicable).
The basic formula:
NGR = GGR – (Bonuses + Taxes/Licensing + Payment Fees/Chargebacks + Provider Fees + Other Costs)
NGR is what lets you evaluate true profitability, monitor cost leakage, and build a marketing strategy that survives reality.
Using Software To Calculate and Optimize Casino-Related KPIs
Automated affiliate marketing software and CRM/analytics systems capture and store data so operators can evaluate acquisition sources and partner performance with accuracy.

If you’re serious about improving Net Gaming Revenue (NGR), you can’t run acquisition blind. You need clean attribution and partner-level visibility to understand what traffic sources actually produce profitable cohorts. A robust affiliate platform like Scaleo helps operators track affiliate-driven acquisition, validate conversions, and measure performance by partner/subID — so you can optimize spend and reduce leakage. Start a FREE Trial.
With the right tracking and analytics stack, operators can monitor acquisition quality, spot anomalies early, and tie marketing activity to measurable financial outcomes.
Analyzing GGR and NGR KPIs
Once you’ve calculated GGR and NGR consistently, the next step is interpretation: what changed, why it changed, and whether it’s a healthy signal or a warning.
Interpreting GGR and NGR KPIs for Performance Evaluation
GGR is top-line. NGR is what your business retains after deductions. If GGR rises but NGR doesn’t, you’re likely buying growth with bonuses/fees — or acquiring low-quality players.
Identifying Trends and Patterns in GGR and NGR KPIs
Trends matter more than one-off snapshots. Look for seasonality (sports events, holidays), promo-driven spikes, and changes in player mix. Spikes in GGR with a simultaneous drop in NGR-to-deposits often indicate bonus leakage, fee increases, or low-quality acquisition.
Sudden drops or spikes can also indicate tracking issues, payment disruptions, or changes in traffic quality. Use analytics to segment performance by geo, device, acquisition source, and player cohorts.

Optimizing GGR and NGR KPIs in Affiliate Marketing
Optimizing GGR is about increasing wagering activity and conversion. Optimizing NGR is about improving the quality and profitability of players after deductions — which is where most operators win or lose long-term.
Strategies for Increasing GGR in Affiliate Marketing
- Target the Right Audience: Focus on audiences with higher deposit intent and retention potential, not just volume.
- Promote High-Converting Offers: Use offers that convert cleanly and reduce churn/bonus abuse patterns.
- Optimize Landing Pages: Improve the deposit/KYC funnel, mobile UX, and page speed to raise conversion.
- Implement Retargeting Campaigns: Bring back non-converters with smarter segmentation and timing.
Strategies for Maximizing NGR in Affiliate Marketing
Maximizing NGR is less about “more campaigns” and more about better cohorts: fewer bonus hunters, fewer fraud patterns, better retention, lower fee leakage, and cleaner acquisition economics.
Focus on Quality Traffic
Quality traffic deposits, retains, and generates repeat gameplay. Track quality by cohort behavior (retention, net deposits, bonus usage, chargebacks), not just first-deposit counts.
Optimize Player Retention
Retention increases NGR far more reliably than one-off acquisition spikes. Align promos, CRM, and VIP mechanics to improve LTV and reduce churn.
Leverage Data Analysis
Analyze campaigns and partners by net profitability. Identify which sources generate high bonus cost, chargebacks, or low retention — then cap, renegotiate, or cut them.
Understanding NGR-to-Deposits and Bets-to-Deposits Ratios
NGR-to-deposits shows how much net revenue is generated from deposits. Bets-to-deposits shows how much deposited money circulates through gameplay. Together, they help you diagnose whether you’re acquiring “good players” or “expensive activity.”
People-Related KPIs: Understanding Player Behavior
People-related KPIs explain why revenue moved: conversion, retention, churn, bounce, and player value. Operators use these to identify funnel friction and cohort quality issues.
Conclusion
GGR and NGR are foundational casino KPIs. GGR shows top-line performance. NGR shows what you actually retain after costs — the metric that decides whether growth is sustainable or just expensive.
If you only take one lesson from this post: don’t optimize for “more activity.” Optimize for profitable activity.
Ready to Optimize Your NGR and GGR?
Want clearer acquisition economics and cleaner partner performance visibility? Scaleo helps operators run affiliate acquisition with reliable attribution, real-time reporting, and performance analysis at partner/subID level — so you can optimize what actually impacts profitability.
What is GGR?
GGR stands for “Gross Gaming Revenue”. It is calculated as “Total Bets (Wagers) − Total Wins (Payouts)”. GGR shows how much players lost before operational deductions like bonuses, taxes, fees, and provider costs.
What is NGR?
NGR stands for Net Gaming Revenue. It is calculated as GGR minus deductions such as bonuses/promotions, payment processing fees/chargebacks, taxes/licensing, provider/royalty fees, and other agreed costs. NGR reflects the casino’s retained revenue after these costs.
How to Calculate GGR?
To calculate GGR, subtract total winnings paid out from the total amount wagered: GGR = Total Bets − Total Wins.
How to Calculate NGR?
To calculate NGR, start with GGR and subtract your defined deductions (bonuses, fees, taxes/licensing, provider costs, chargebacks, and other agreed costs): NGR = GGR − Deductions. The exact deduction list depends on your operation and contract definitions.
Why is it important to analyze GGR and NGR for online casinos?
Because GGR shows top-line performance, while NGR shows retained revenue after costs. Tracking both helps operators understand profitability, cost leakage, promo impact, and whether acquisition channels generate profitable cohorts.
How to Improve GGR?
Improve GGR by increasing conversion and wagering activity through better onboarding, stronger offers, optimized UX, and targeted acquisition. Track changes by segment (geo, device, cohort, source) to identify what actually drives growth.
How to Improve NGR?
Improve NGR by reducing leakage and improving cohort quality: cap bonus abuse, lower fee waste, reduce chargebacks/fraud, improve retention, and evaluate acquisition sources by net profitability — not just deposit volume.