Marketing performance dashboard with data visualization – why do you need it, how do you choose the right one for your business, and will the most expensive one always necessarily be the best one?
Let’s find out!
In today’s digital world, marketers must approach data with a theoretical strategy as well as an almost artistic sensibility. A variety of marketing dashboards can help with this by offering easy-to-read and visually pleasing views of a variety of main metrics and KPIs.
By monitoring these metrics, digital marketers can act on their data and enhance the efficiency of their campaigns, websites, and other assets. A marketing report prototype is a must-have for any well-equipped marketing team.
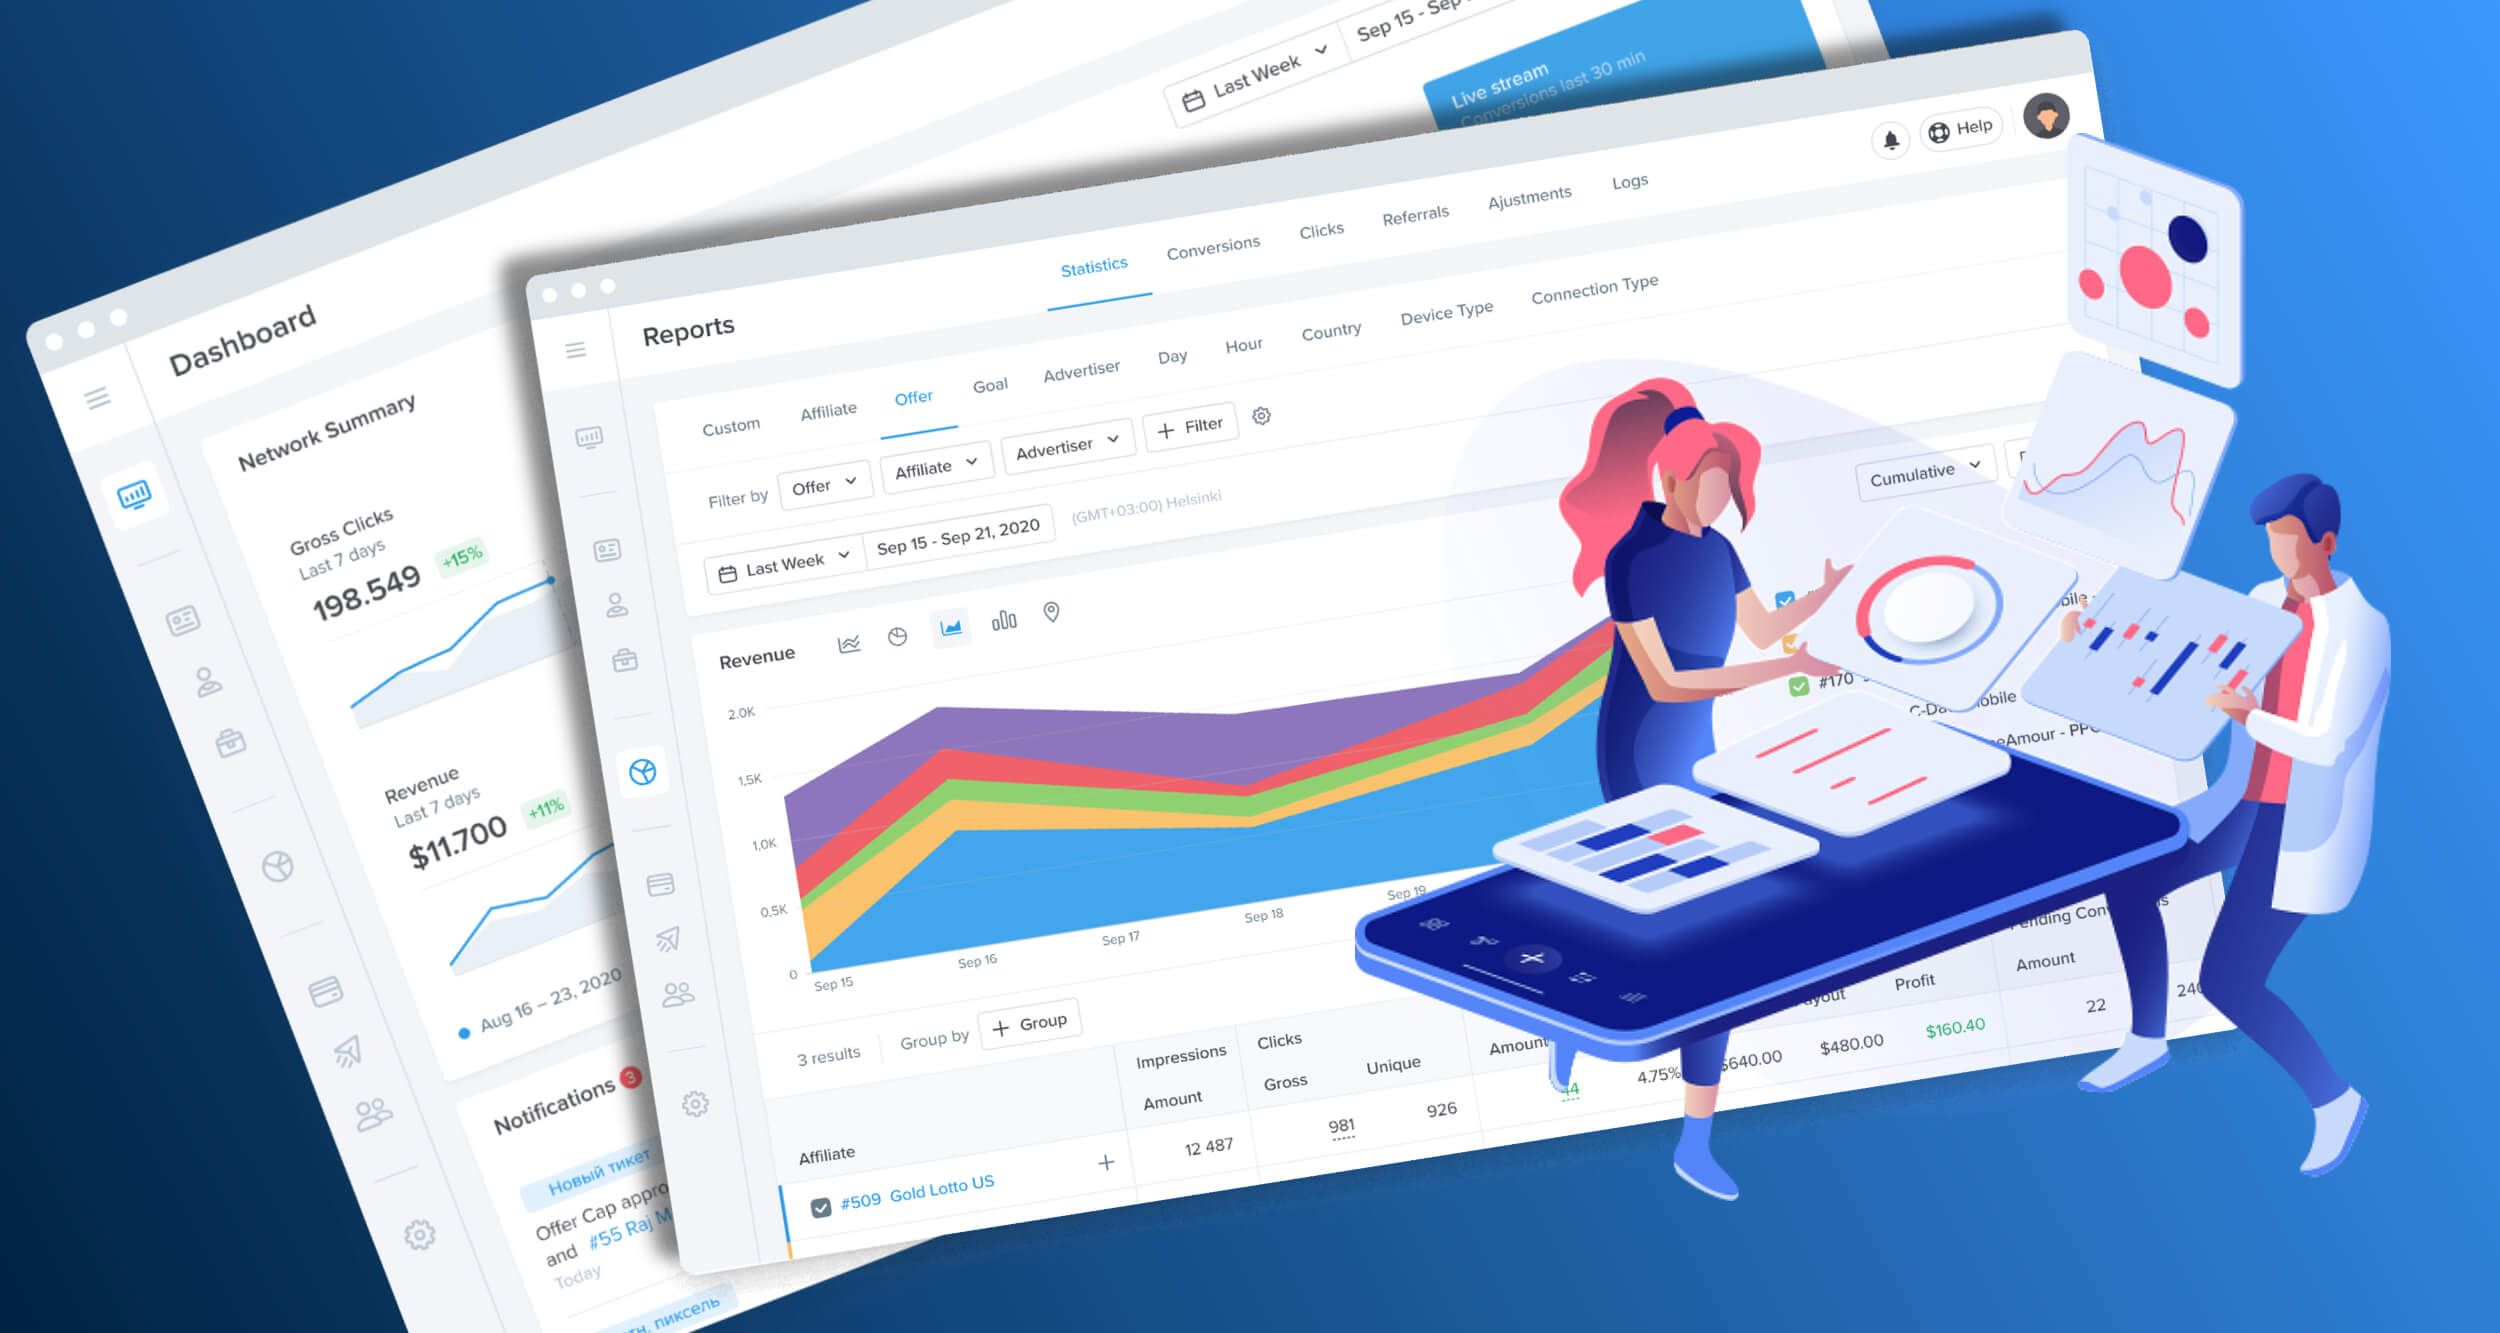
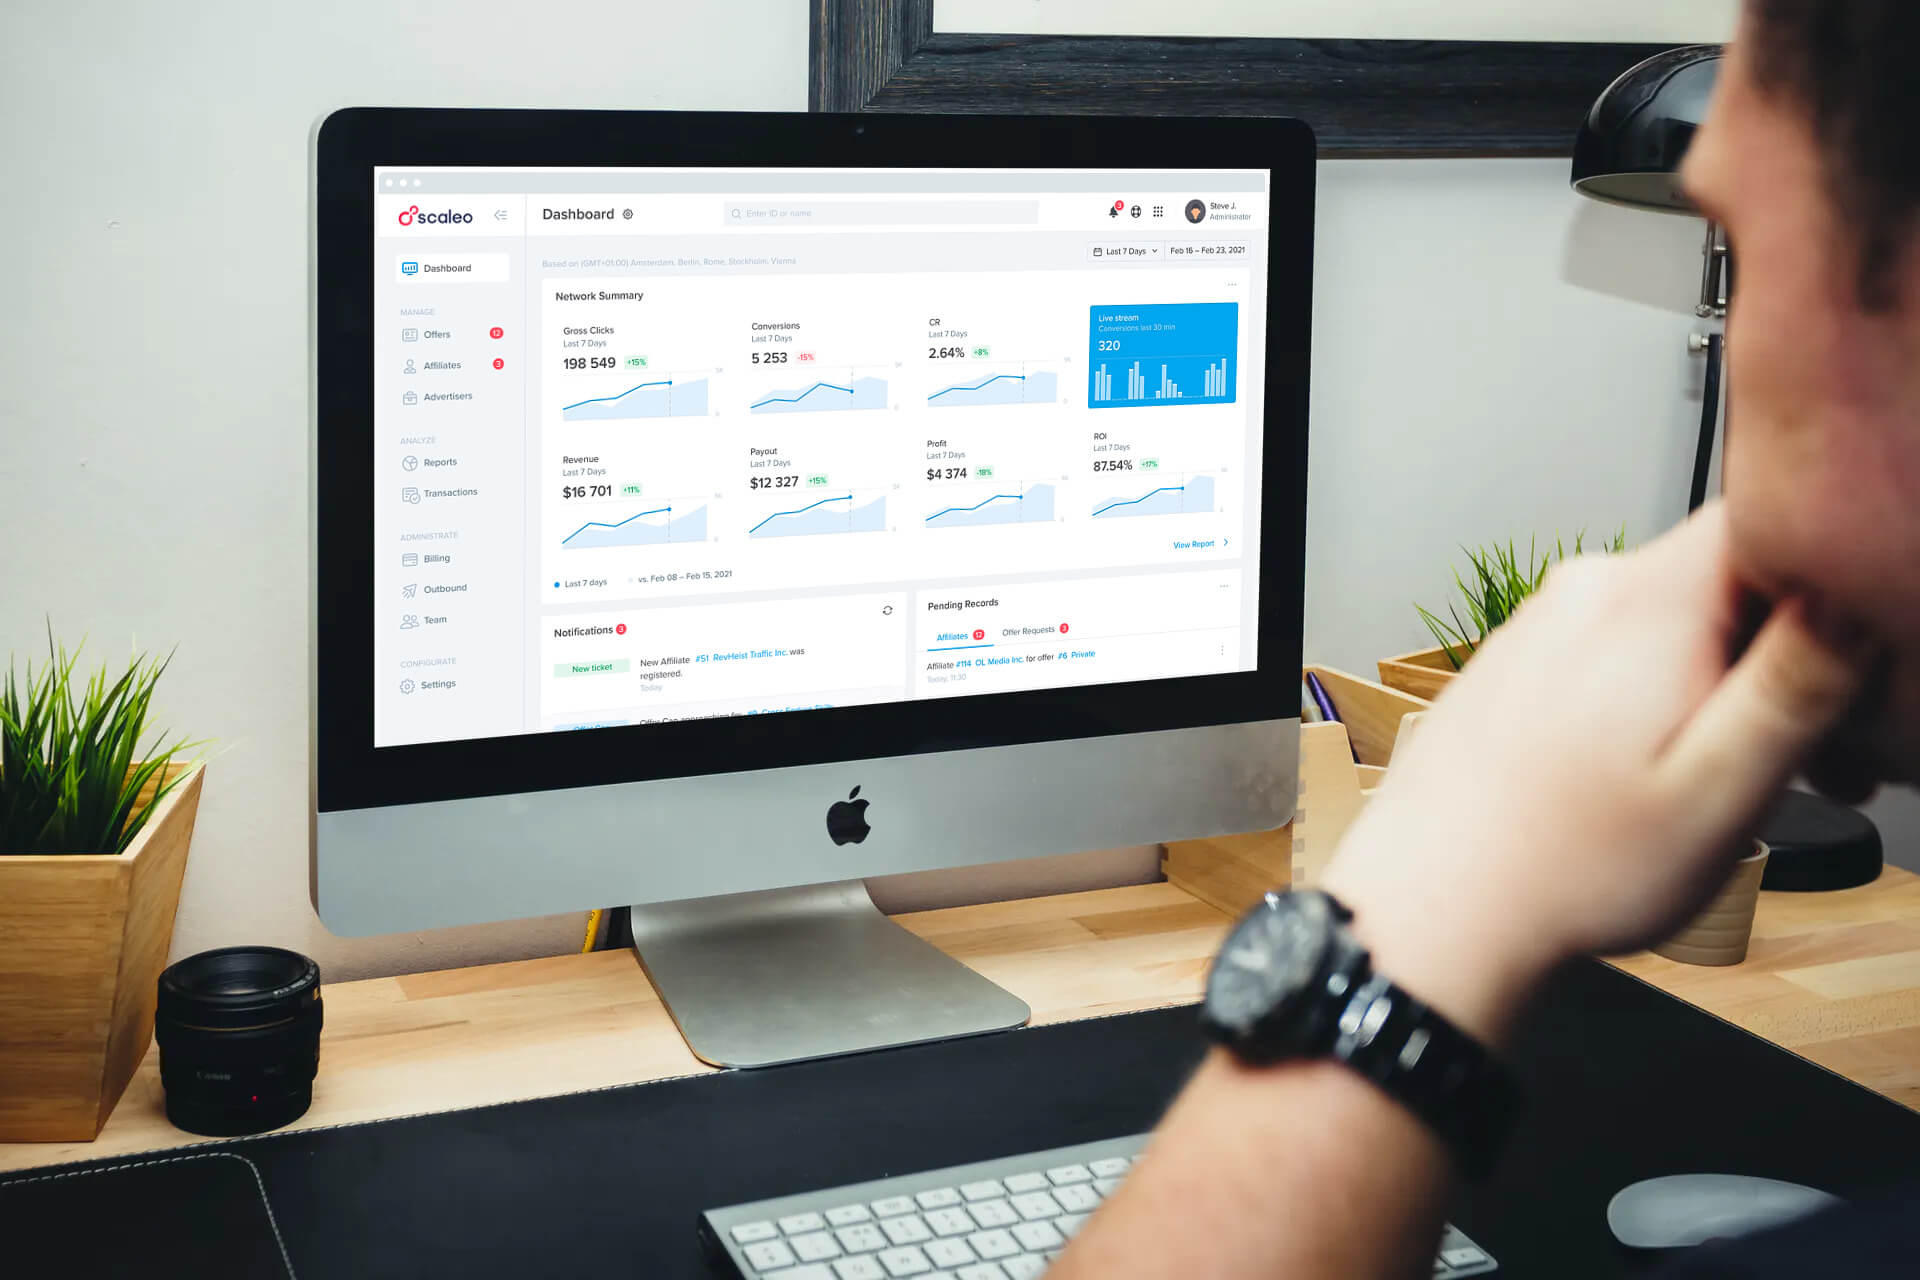
Scaleo affiliate marketing dashboard
The performance marketing dashboard is something that we, at Scaleo, dedicate a lot of time to.
We assist marketers in collecting data from different sources and consolidating it into a single dashboard that displays all the success and failure factors of your online referral business.
Data generated by digital marketing campaigns range from high-level sales reporting to program and channel-specific metrics. This data is needed for calculating ROI and campaign effectiveness, but it is not simple to comprehend.
It’s not unusual for marketers to use a slew of different resources (third-party analytics software, custom back-end systems, and elaborate Excel spreadsheets). Affiliate marketers need these to monitor program success, and activity levels and still have only a hazy understanding of how marketing campaigns relate to business goals.
These investments in diverse resources are costly; if they do not produce actionable data insight, they are a waste of money.
Marketing investment in data analysis tools is projected to rise from 4.6% to 22% of overall marketing budgets this year. Still, companies are currently using less than a third of the data at their disposal to make strategic decisions.
The Magic of the Best Marketing Dashboards
Marketing performance dashboards aggregate data from various sources and view it in a single location in real-time. They offer a high-level overview of how promotions are performing, offering marketing experts and C-level executives a single source of truth as well as the opportunity to dig down for more in-depth analysis.
The majority of marketing metrics dashboards put a strong focus on reporting. Indeed, a marketing reporting dashboard is key.
They demonstrate a number of primary performance indicators (KPIs) and other data points using dynamic visual aids (charts, graphs, heat maps, scatter plots, timelines, and so on) and plain text. Here are some typical examples:
- Earnings (by channel or affiliate program)
- Prospects and opportunities
- Conversion % or rate
- Lead pipelines/cash flows
- Geographical details (based on IP address)
- Trends (upwards, downwards?)
- Source (organic search, paid media, site referral, social, email)
- Metrics for content interaction (visitors, open rate, click-through rate, bounce rate)
- Attribution (how various touchpoints shape a customer’s journey)
While there are several exceptions due to the tech industry’s diversity, marketing KPIs dashboards can be found in many forms.
Marketing Performance Dashboard
A marketing performance dashboard is designed to provide a high-level sense of the overall conversion funnel, showing the funnel as well as other relevant metrics to assist marketers in making informed decisions about conversions, sales, and the source of these conversions.
Each lead, website visit, and win is assigned a monetary value, allowing marketers to assess campaign performance.
The marketing success dashboard will usually include KPIs and metrics such as return on marketing expenditure, target completion rate, traffic sources, and purchase funnel.
The metrics dashboard is both a pain reliever and a decision-making booster.
Dashboard for Digital Marketing
A digital marketing dashboard can be used to monitor the effectiveness of your company’s online marketing efforts. This type of dashboard allows you to monitor your campaigns and other digital marketing activities in real-time, allowing you to make informed decisions on how to spend your marketing budget.
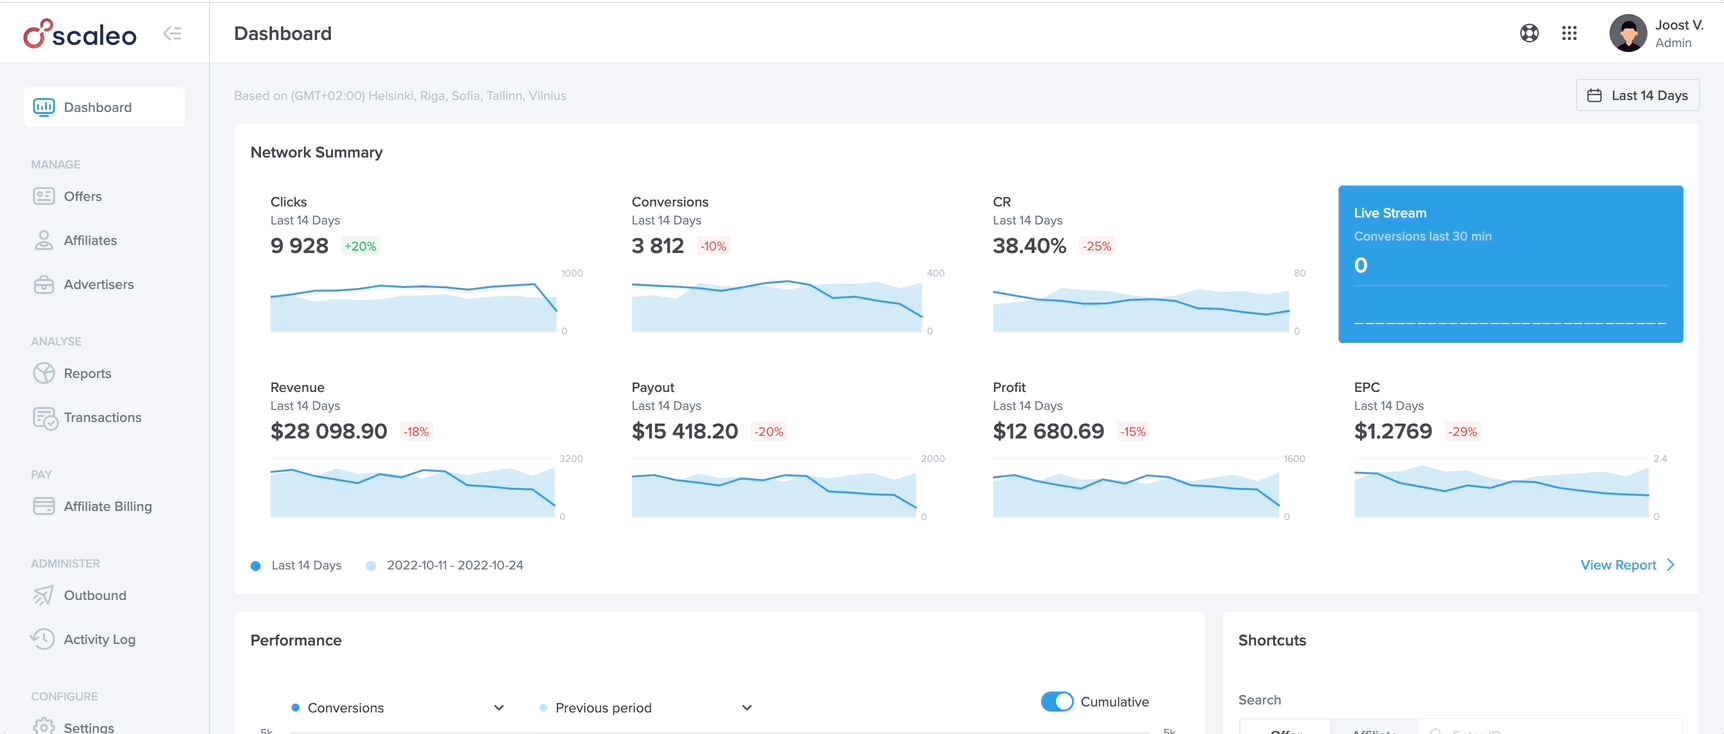
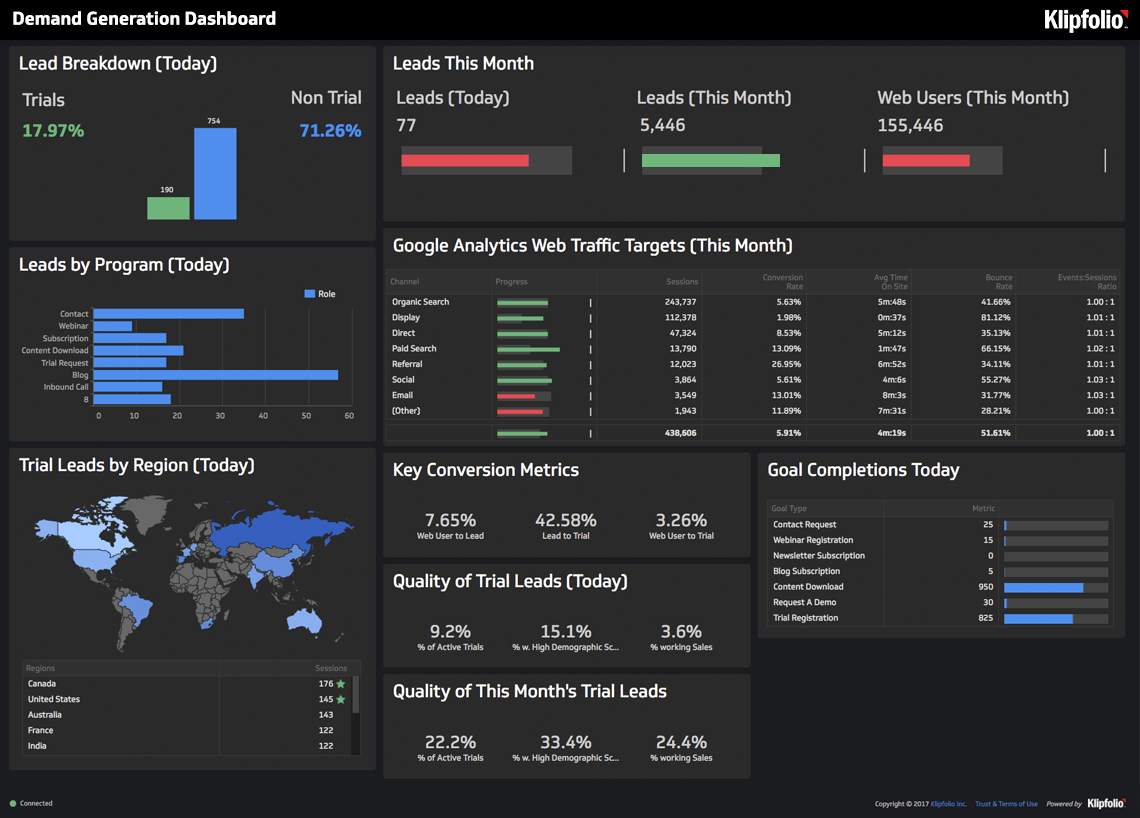
Digital marketers must monitor a wide range of metrics across multiple platforms, including social media, advertising, website, email marketing, and lead generation. If you’ve ever used an email marketing dashboard you are familiar with how data visualization helps you understand user behavior. This marketing dashboard focuses on lead generation data, showing progress against targets, and showcasing data for lead generation metrics and web analytics metrics.
Good example: Scaleo’s marketing report dashboard:
Dashboard for SEO Analytics
A Search Engine Optimization Analytics dashboard can be considered a one-stop-shop for all of your company’s web analytics results, offering a comprehensive view of your SEO success from multiple angles through various metrics.
TIP: also try an optimization calculator.
SEO is a critical practice for any marketing team, and marketers use various SEO KPIs and metrics to monitor the success of their efforts on their website for organic search results and monitoring improvements month after month.
An SEO dashboard will assist in identifying website areas that need improvement, top conversion keywords, top-performing sites, and much more. SEO, among other things, aims to drive traffic to a website or specific page through internal linking, back-linking, and keyword tracking.
The metrics highlighted in this dashboard are derived from analytics tools such as Google Analytics and provide marketers with a wide range of actionable insights. This includes the number of keywords on the first page in Google, organic traffic and other traffic sources, internal/external links, page load speed, top landing pages, number of indexed pages, and much more.
Good example: Ahrefs
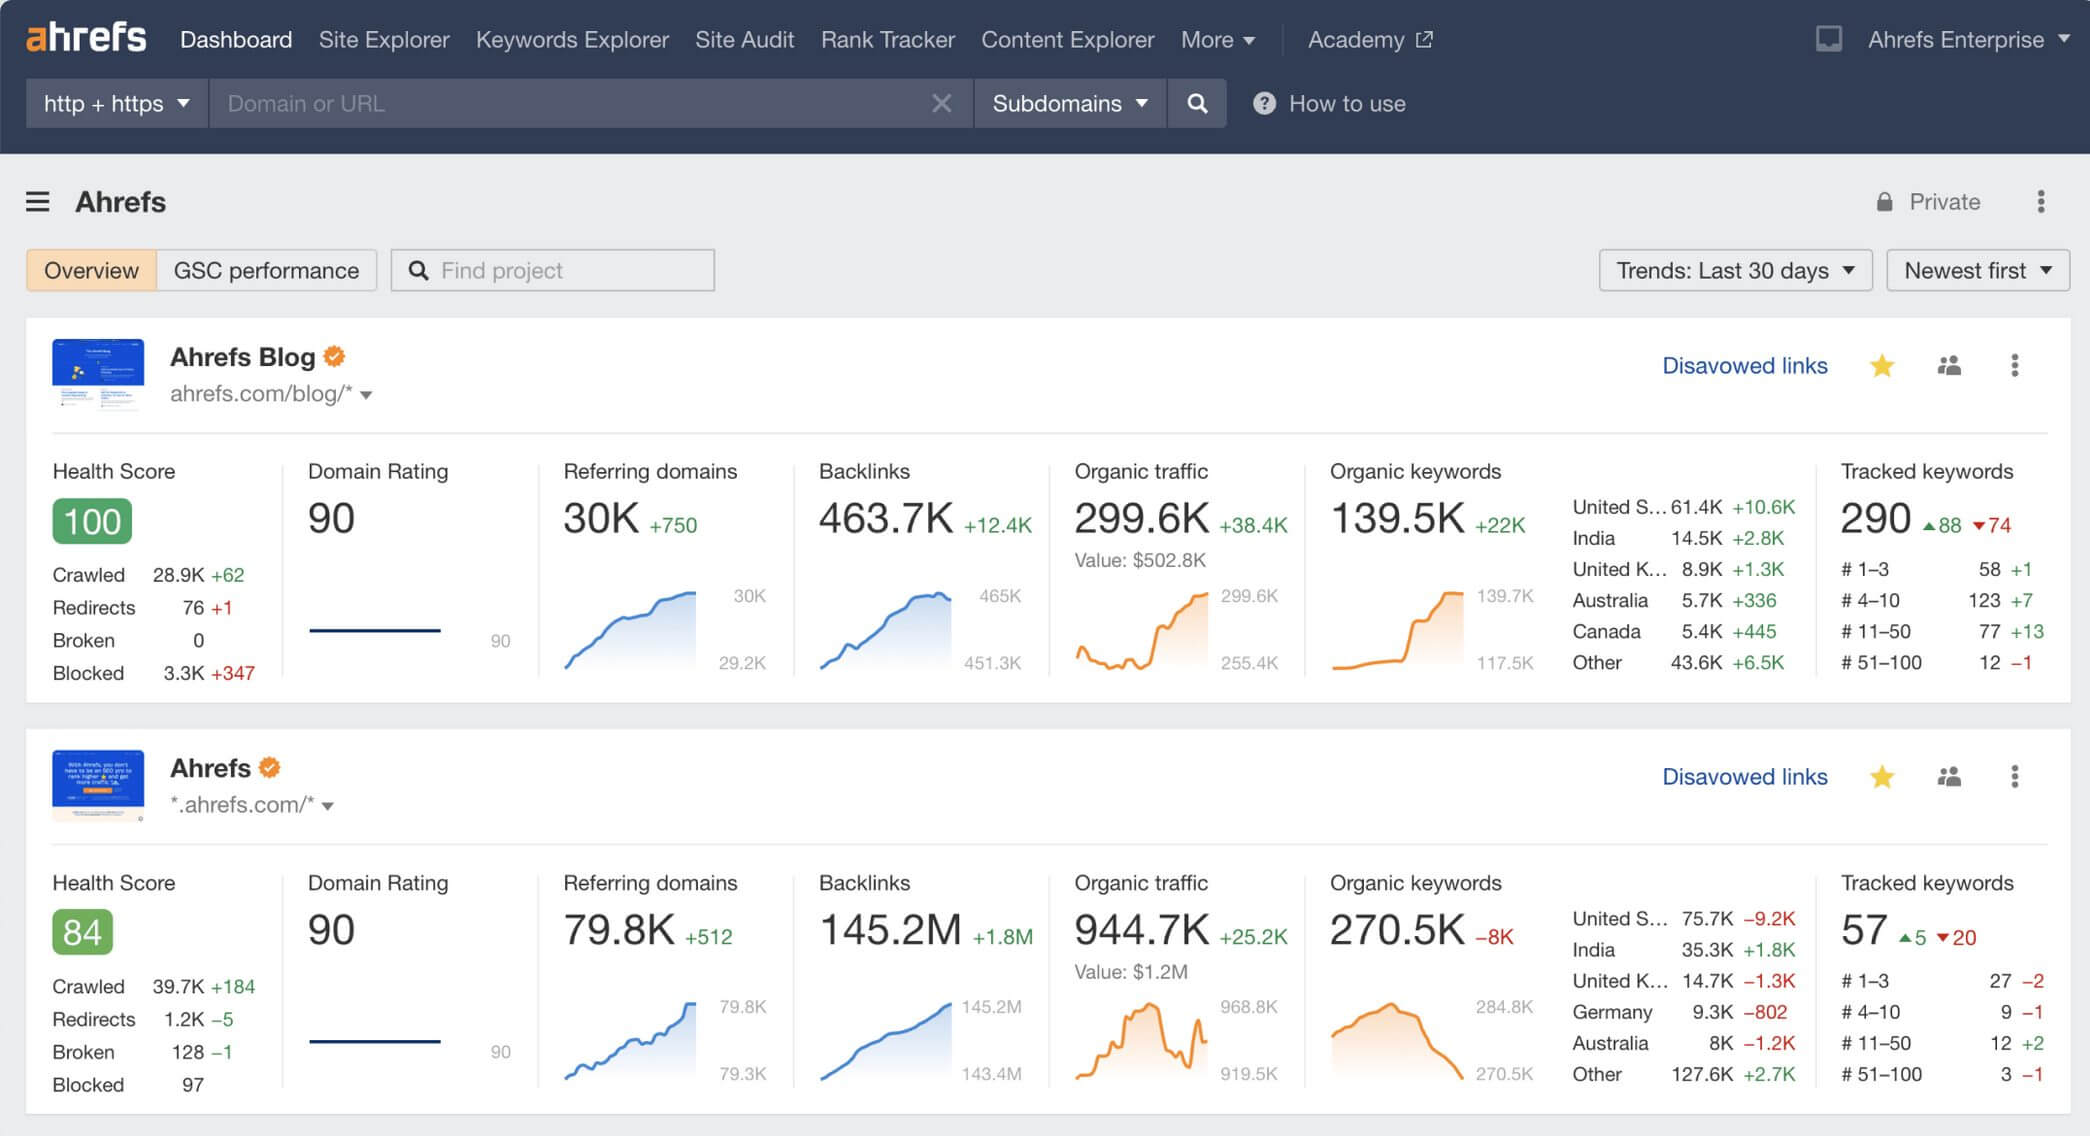
Ahrefs provides you with a great performance visualization of your SEO efforts (as well as your competitor’s performance).
Dashboard for eCommerce Marketing
If you are in an e-commerce business, you absolutely need a digital marketing reporting dashboard. This form of marketing dashboard serves as a central repository for data aggregation that affects the company’s day-to-day operations, budget, and decision-making. What is monitored on an eCommerce marketing dashboard is determined by what you want to achieve with data?
The eCommerce marketing dashboard shows the metrics and KPIs that eCommerce site marketers must track on a regular basis.
- cost per lead,
- web traffic sources,
- MRR,
- return on marketing investment (ROI),
- ARR,
- churn rate,
- retention,
- new subscribers,
- added to cart,
- revenue by communication form
- target fulfillment rate
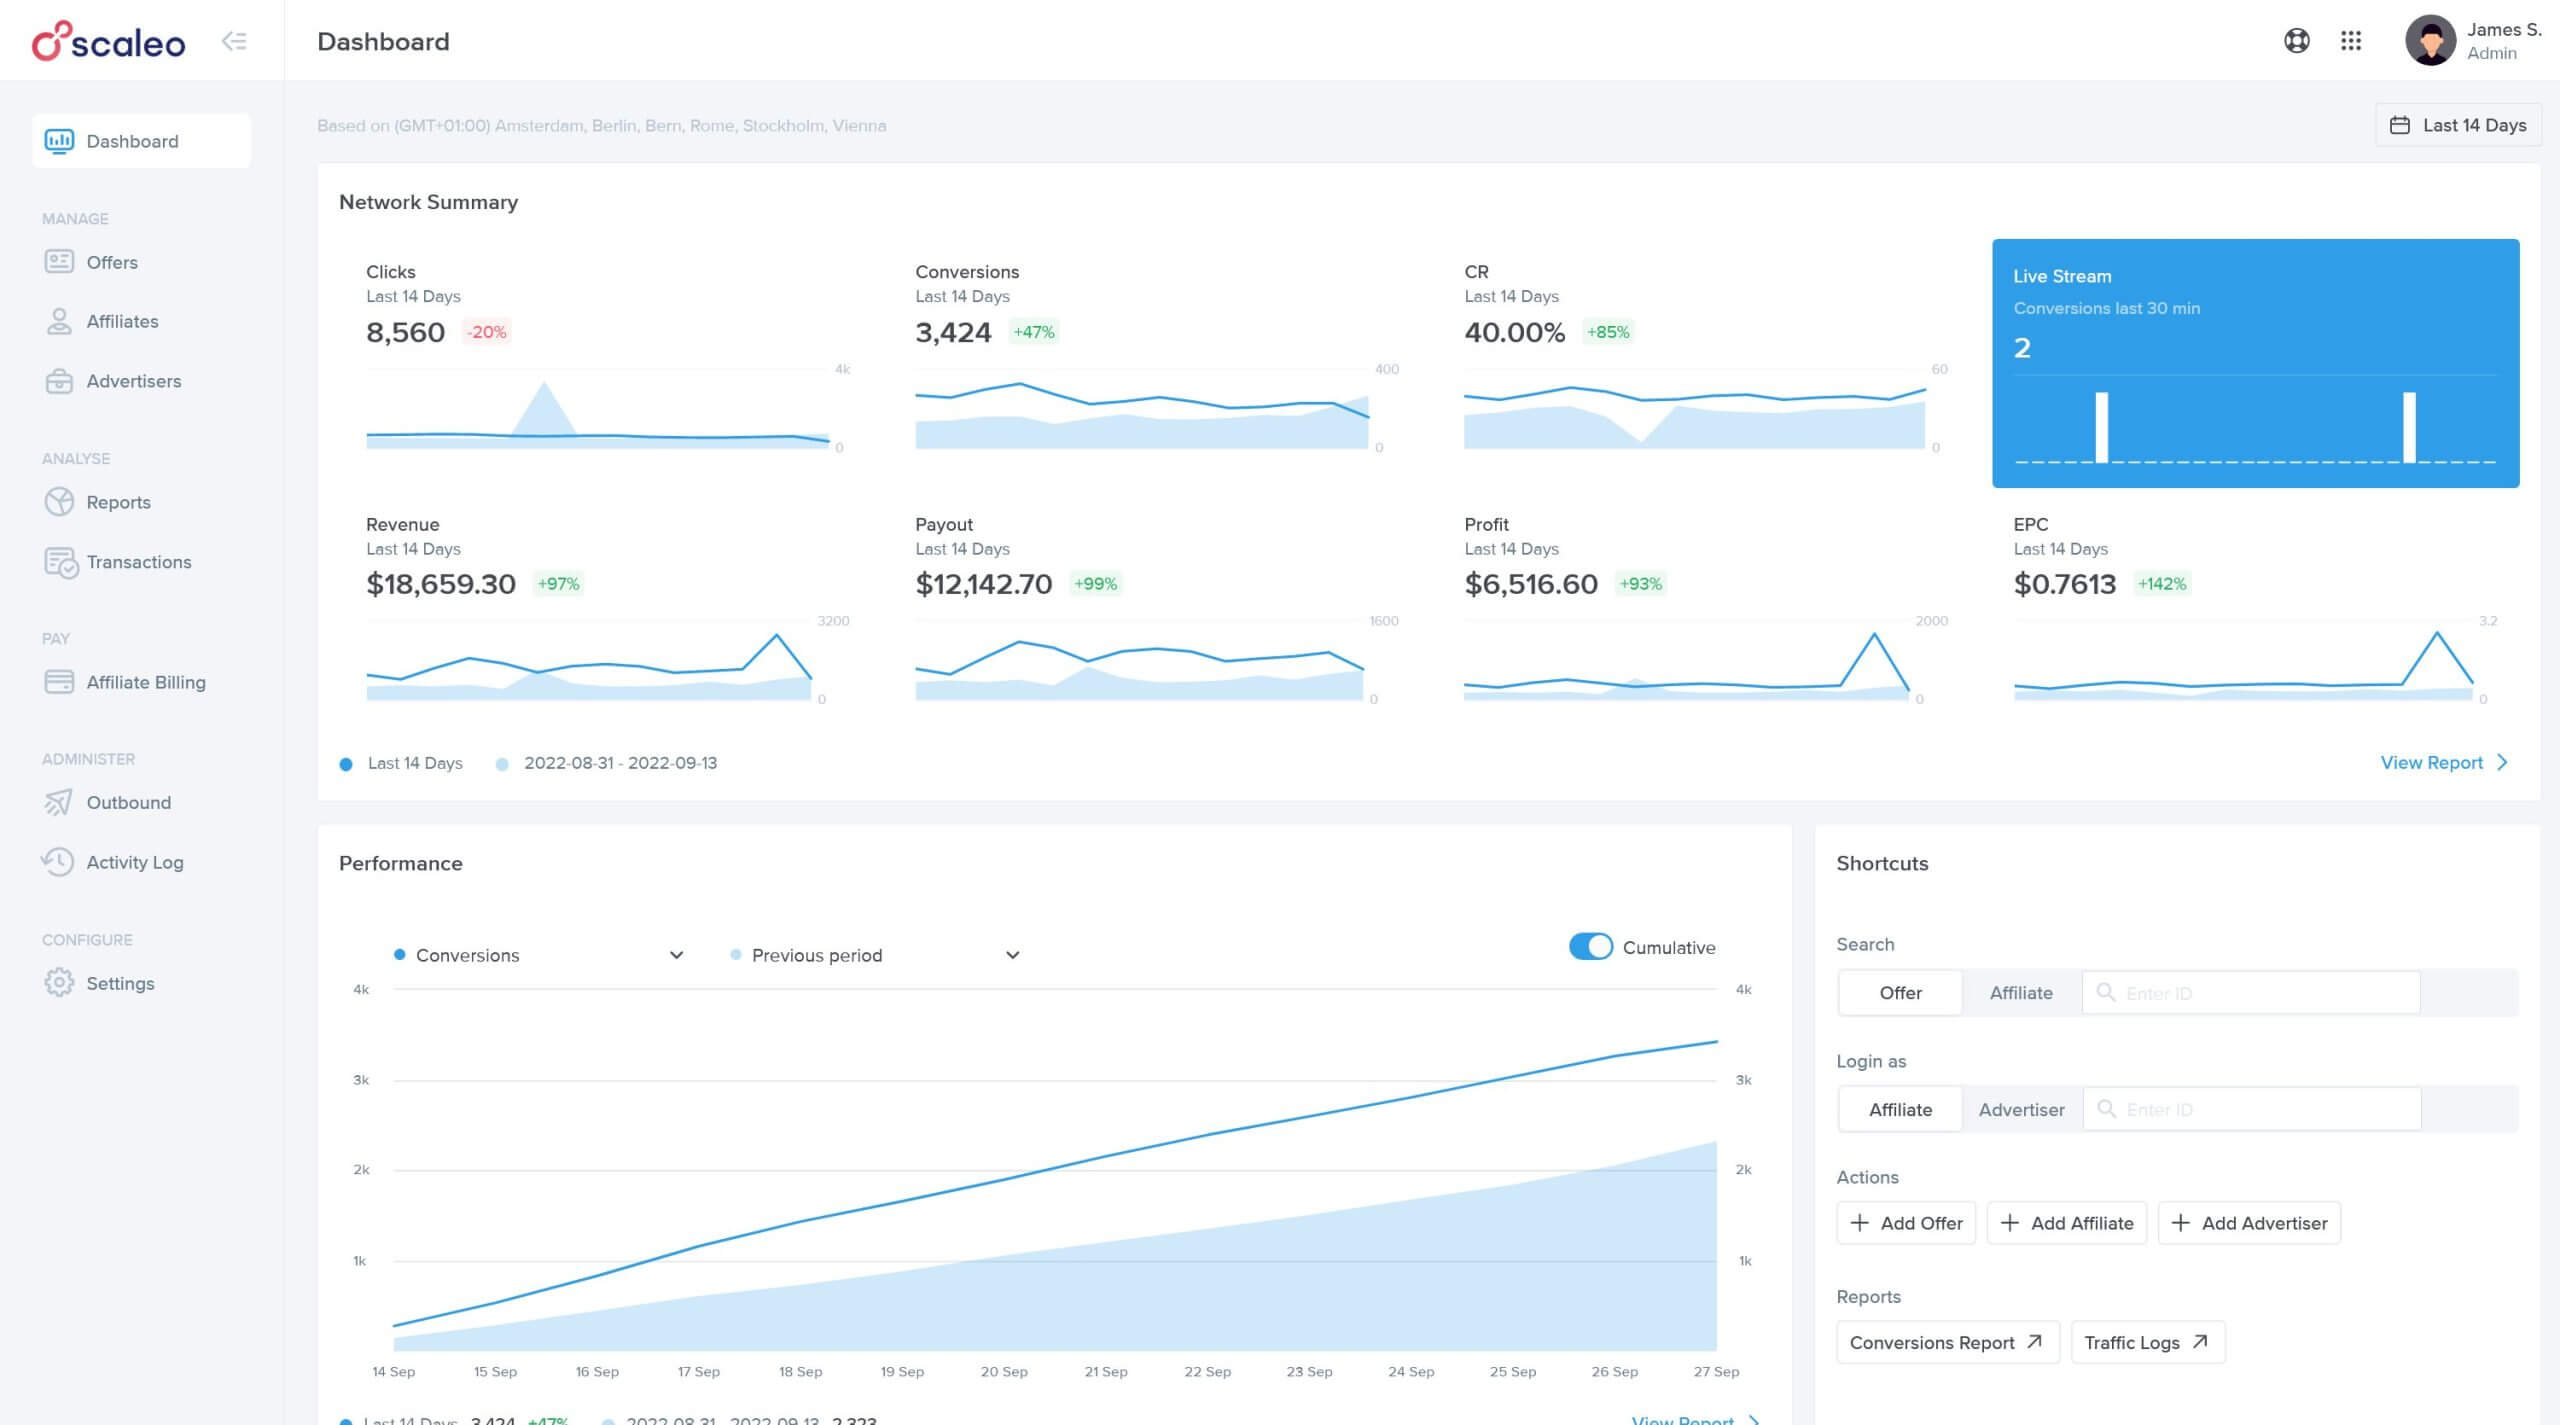
These are some of the metrics you can monitor with this type of marketing dashboard.
Again, A good example is Scaleo since it can be used both for affiliate networks and e-commerce brands.
Dashboard for Web Analytics
A web analytics marketing dashboard monitors website performance in real-time, enabling you to monitor how your website is performing in relation to your marketing goals by concentrating on a high-level but still detailed view of your site’s performance over a variety of timeframes.
This dashboard allows you to track metrics such as online conversions, page views, and visitors to measure the success of your website. Web analytics can be used in a variety of ways, including eCommerce, user interface, SEO, social media, and digital marketing, with each use case providing a unique viewpoint on the success of your website.
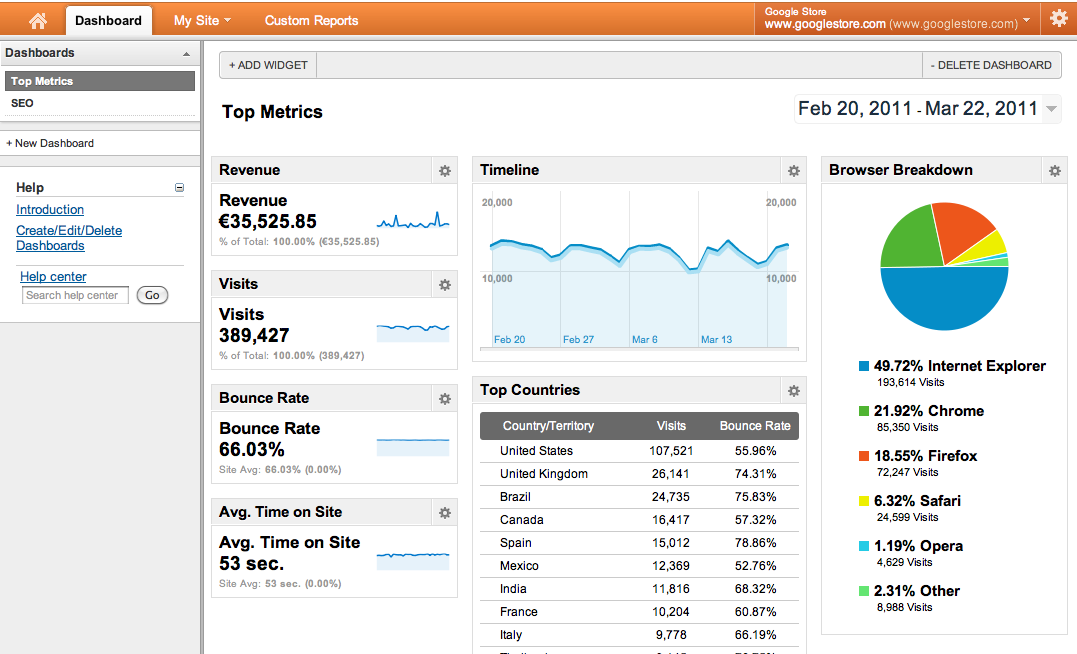
Among the many metrics and KPIs tracked by a web analytics dashboard are bounce rate, page views, website visits, pages visited per session, referral traffic, unique and new visitors, and traffic sources.
An example is Google Analytics 4:
Dashboard for Social Media
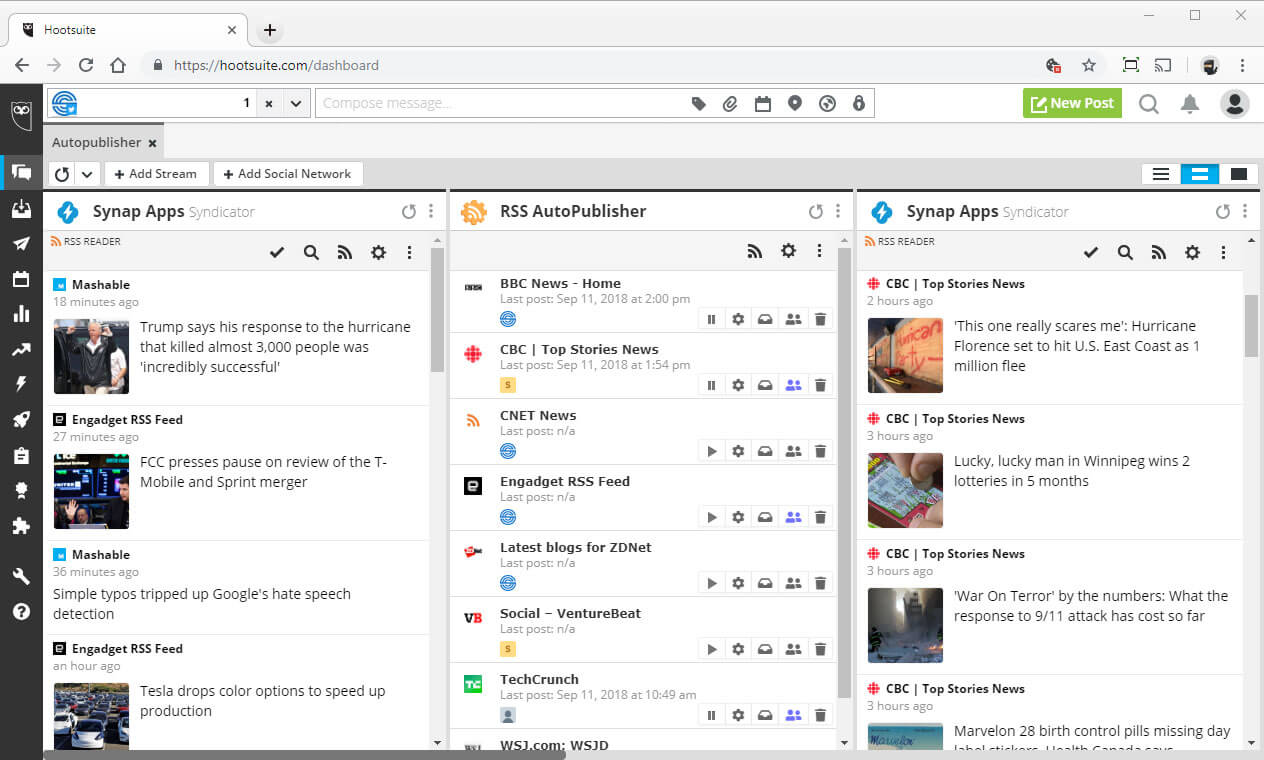
A social media marketing dashboard visually represents the relationship between social performance and website performance, allowing you to assess the effectiveness of your various social media campaigns.
Although social media marketing is one of today’s most effective marketing platforms, smart marketers understand that their social campaigns can have an impact on broader marketing goals. This dashboard also tracks metrics and KPIs such as social interactions, traffic sources, and goal completion rates.
A good example is Hootsuite:
Dashboard for AdWords Campaigns
The AdWords campaign marketing dashboard allows you to closely monitor the ROI of Google Ads campaigns and the main performance indicators (KPIs) and metrics that affect them. Tracking returns on marketing expenditures is critical for any successful AdWords campaign to ensure you’re investing the right amount of money to obtain leads.
Monitoring keyword rankings, CPCs, audience targeting, bidding techniques, CTRs, and impressions will help you better understand which topics and keywords your PPC strategy should prioritize.
Check, for example, Starbucks’ marketing strategy to learn from this case study.
Another good example is KlipFolio.
Other types of marketing dashboards:
Best Marketing Dashboards for Enterprise Marketing
This type of marketing dashboard provides executives and management with an immediate visual representation of critical enterprise metrics and key performance indicators (KPIs). The business dashboard usually allows you to track and monitor the enterprise’s success across various divisions and sectors, enabling management to be aware of any problems in real-time and stay agile.
Agency Command Center
The agency command center dashboard offers a bird’s-eye view of your agency’s success. You can aggregate and monitor all of your client output in a single location, eliminating the need to move between channels and accounts.
Through this dashboard, your organization will use data to uncover impressive benchmarks that can be included in your sales pitch, allowing you to gain more business.
Marketing Dashboard for CMOS
The CMO marketing dashboard provides a summary of your company’s marketing services, including lead generation and website results, as well as email marketing and social media. It is intended to respond quickly to the critical question of “how are we performing?” Here’s an example of a dashboard summary.
Metrics from various sources are woven together to provide a comprehensive view of marketing success, enabling executives to track performance and make informed marketing strategies regularly.
Online Marketing Dashboard
Since online marketing encompasses a wide range of platforms, an online marketing dashboard is intended to provide marketers with a high-level overview of key marketing channels. Email marketing, inbound lead generation, social media, revenue generation, digital ads, and website success are among the platforms highlighted in this dashboard.
Lead conversion rates are one of the most important metrics this marketing dashboard monitors since they display how visitors to your website turn into leads and conversions or customers. Integration of the marketing CRM dashboard is also extremely beneficial. Click here to see more CRM dashboard examples.
Standalone BI Dashboards:
In this case, the dashboard(s) would be part of a separately acquired business intelligence application. The app will basically pull data from whatever sources you say it to, such as your CRM, website, social media accounts, Adwords account, and our marketing automation platform.
Since they are committed solely to business intelligence and drawn from several sources, standalone tools typically offer a more unified, bird’s-eye view but are more expensive.
Marketing Automation (MA) Tool: Dashboards built into a marketing automation platform may provide a more detailed, granular view of specific campaign components but may take some critical thinking to put together at a high level. The obvious advantage here is that you would not have to pay for a second machine (assuming you already use marketing automation software).
Marketing Dashboard Success Factors
The best marketing dashboards will share some features. If you’re looking for a solution that’s both sustainable and easy to use, make sure it has the following characteristics:
A marketing dashboard should be easily customizable to represent your business interests and position in the department. Users can configure dashboards on several platforms by dragging and dropping widgets onto the GUI. Such higher-level data can be limited to managers or executives using role-based access controls.
Mobile-Friendly Marketing Dashboards
There aren’t many advertisers who just work from their desks. It’s critical to have access to real-time insights whether you’re at work, at a meeting, or catching up from home after hours. Don’t spend money on a marketing dashboard that isn’t user-friendly, either via a native app (which is usually preferable) or at the very least a mobile web interface.
Scalable means that the dashboard will evolve with your data projects as they become more resource-intensive. It also implies that the dashboard would be able to handle a broad range of data sources. It can include modular APIs for custom integration as well as out-of-the-box compatibility with critical systems like your CRM, marketing automation, ERP, and accounting applications.
Most performance dashboard examples are demonstrated on a desktop, however, don’t underestimate the usage of mobile phones and tablets in 2022.
Conclusion
All the best marketing dashboards visually show key marketing metrics and KPIs, while visualizing your data in the best possible, easily digestible way. This can be done the old way using an excel spreadsheet, business intelligence (BI), or marketing software like Scaleo.
Dashboards are intended to present data to advertisers and other related stakeholders to allow for quick analysis and extraction of key insights. The goal is to provide near real-time visibility into how well your marketing activities are performing.
Your dashboard should contain a range of reports tailored for regular, weekly, or monthly data reporting, allowing you to make corrections to your marketing activities more quickly. In this post, we have showcased and analyzed different marketing dashboard examples, web analytics dashboard examples, reporting dashboard examples, and other forms of data visualization which can help your marketing dashboard come alive.
How to choose a marketing campaign dashboard?
If you need a purely marketing campaign dashboard, your best choice would be a visually pleasing and aesthetic data visualization dashboard. Remember that all marketing dashboard metrics should be visually appealing so that users will find it easy to follow.
What’s the best marketing KPI dashboard?
Any affiliate tool with a virtualization dashboard where you can see your goals and how far you are from reaching them will serve as a KPI dashboard. Most of the time, you can set “goals” in Google Analytics, for example. You may have a goal of collecting someone’s email, visiting a particular page, or having a number of page views per visitor. Having set up these KPIs, you will be able to monitor them once you have decent traffic to analyze successfully.
What’s the best campaign performance dashboard?
If you are looking to monitor your affiliate campaigns or media buying, the best campaign performance measuring dashboard would be Scaleo. It combines all the usability of an affiliate marketing software with a fantastic interface and also basic and easy-to-follow functionalities of a classic campaign tracking tool. The campaign performance dashboard is an idea of getting an overview of your marketing efforts all in one place.
Last Updated on November 28, 2023



![iGaming Marketing 2024 Stats: Power Up Your Affiliate Ads Strategy [Updated] iGaming Marketing 2024 Stats: Power Up Your Affiliate Ads Strategy [Updated] - Marketing Dashboard](https://www.scaleo.io/blog/wp-content/uploads/2024/03/iGaming-affiliate-marketing-stats-270x180.png)